Industrial Properties
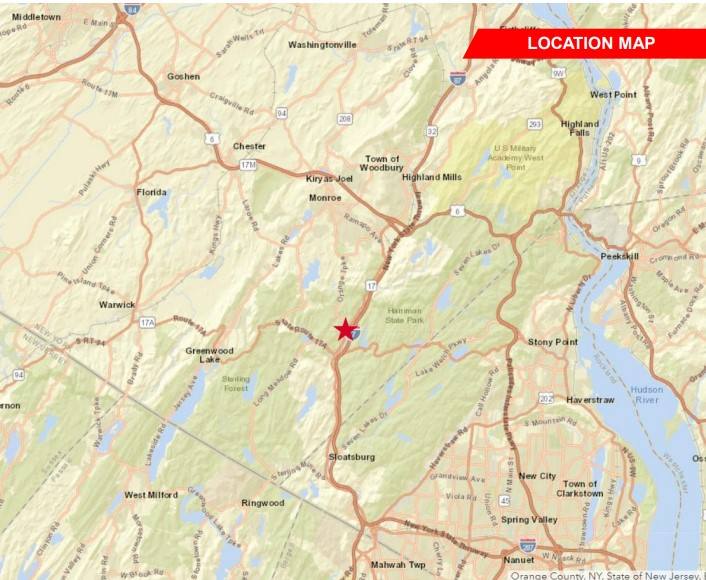
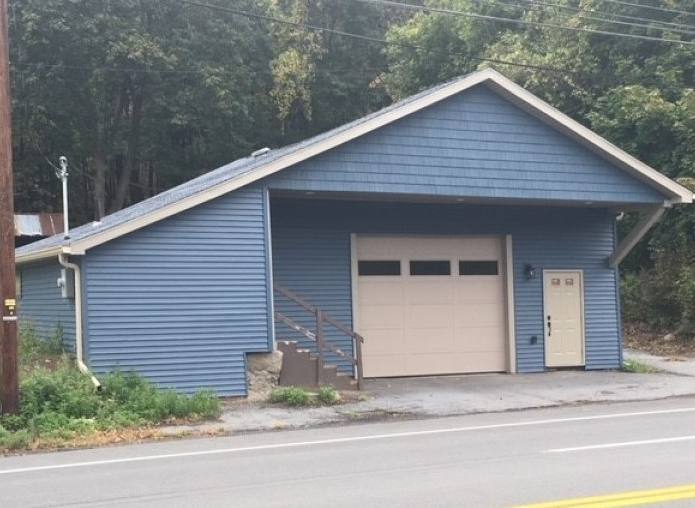
1099 Route 17 Tuxedo Park, NY 10987
1099 Route 17 Tuxedo Park, NY 10987
Details & Description
Listing Agents

John Coladonato
O: 845-787-1378
M: 845-258-8424
jcoladonato@pyramidbrokerage.com
O: 845-787-1378
M: 845-258-8424
jcoladonato@pyramidbrokerage.com
While we strive to provide the most accurate information, all listing information, and demographic data, is provided by third-parties. As such, MyEListing will not be responsible for the accuracy of the information. It is strongly recommended that you verify all information with the listing agent, and any relevant agencies, prior to making any decisions.