Industrial Properties
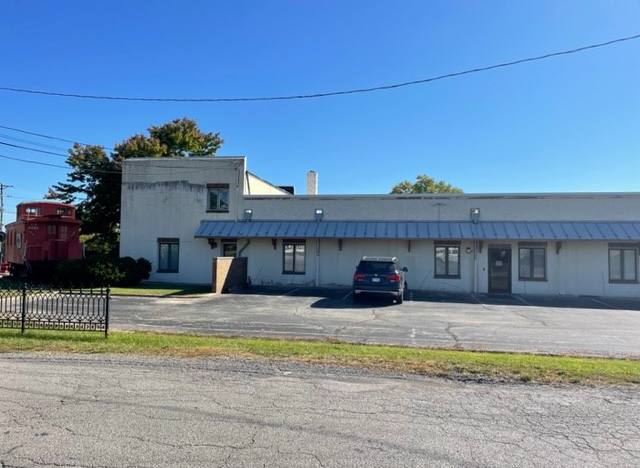
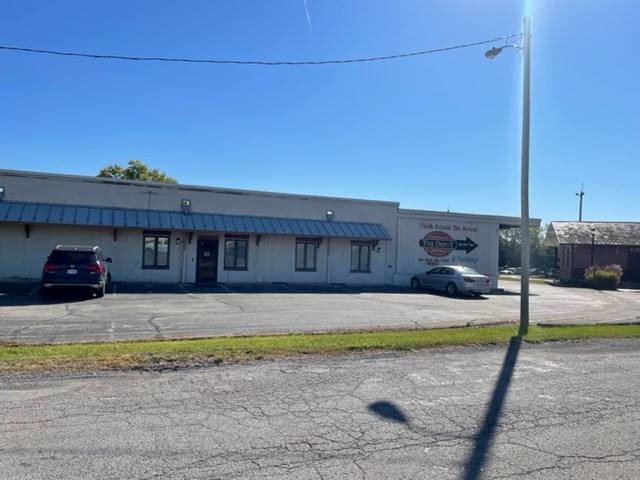
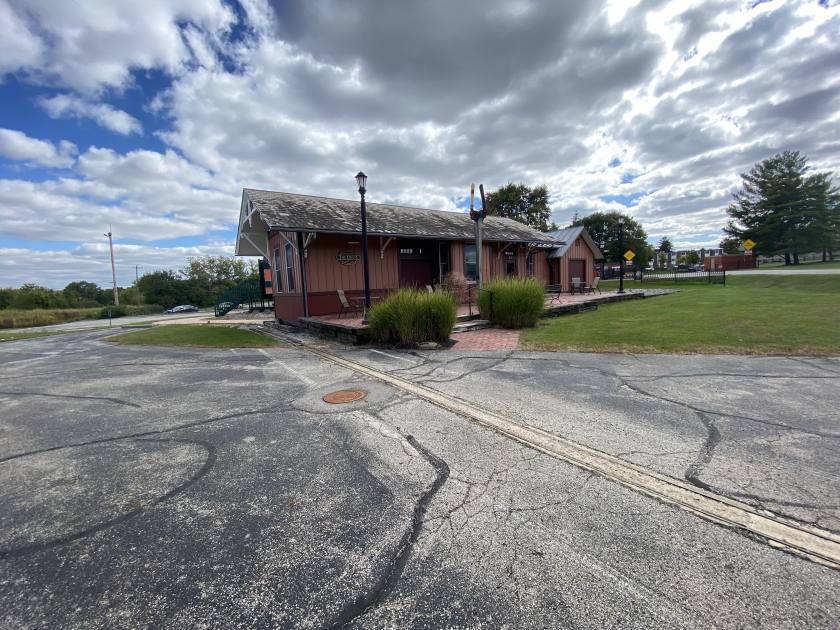
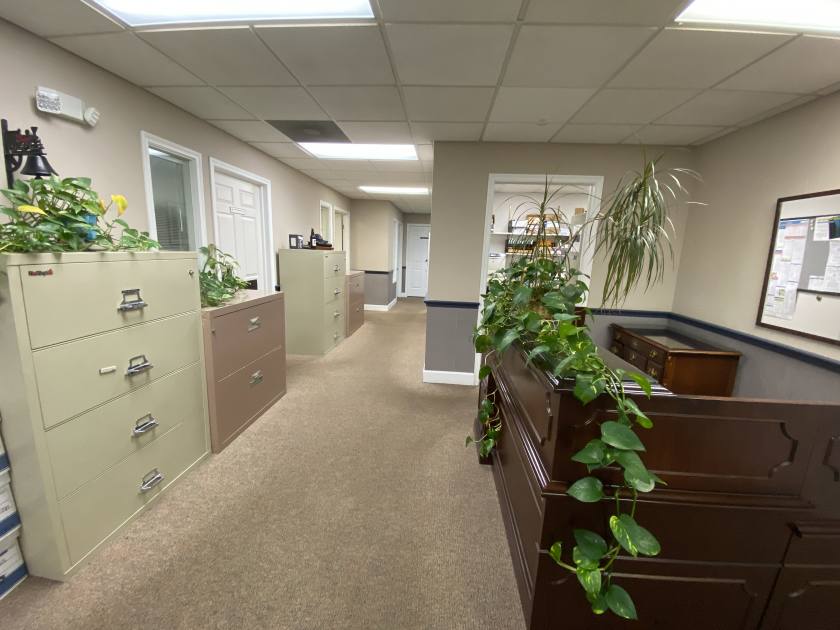
919 Old Henderson Road Columbus, OH 43220
919 Old Henderson Road Columbus, OH 43220
Details & Description
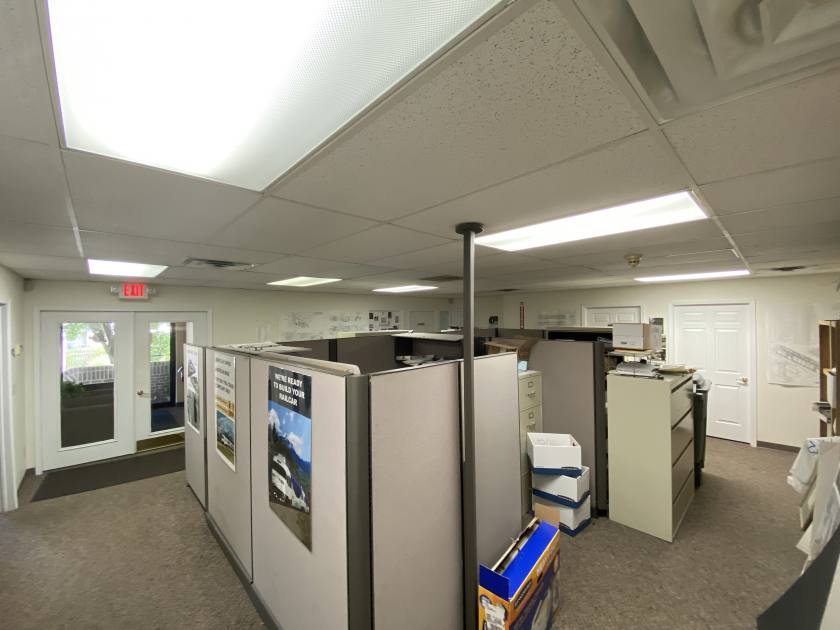
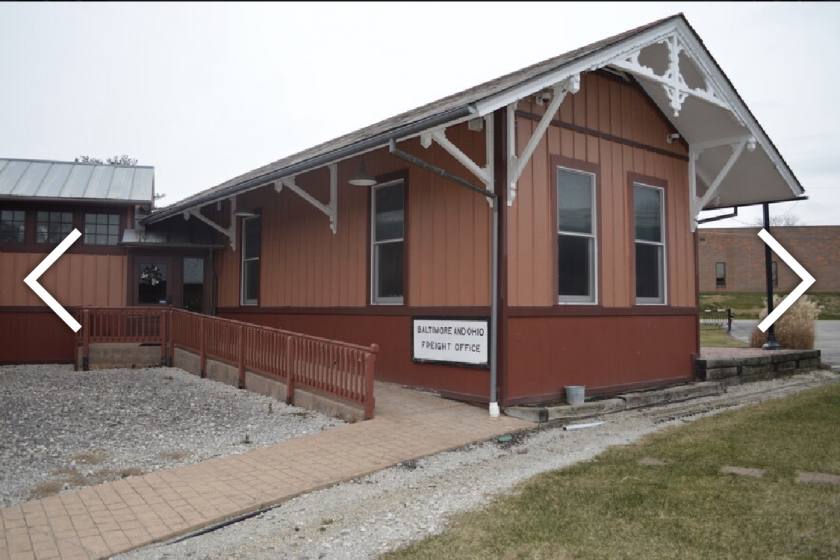
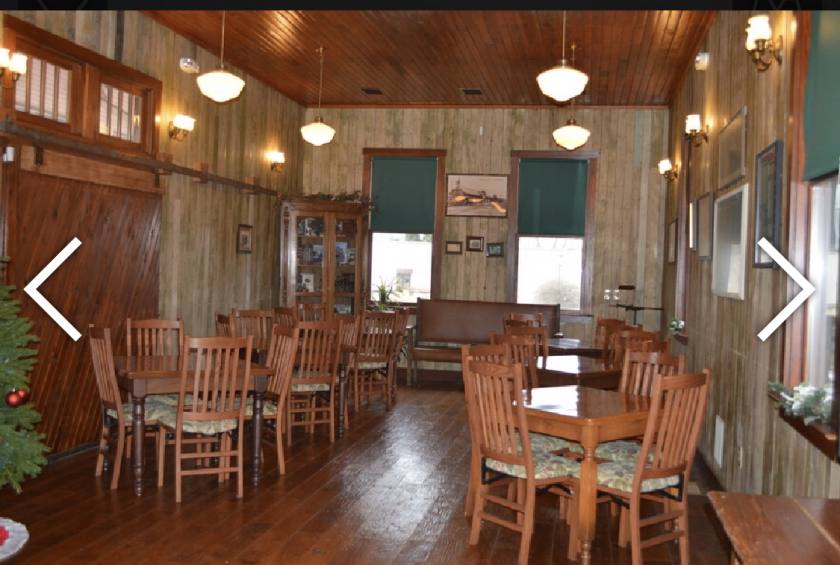
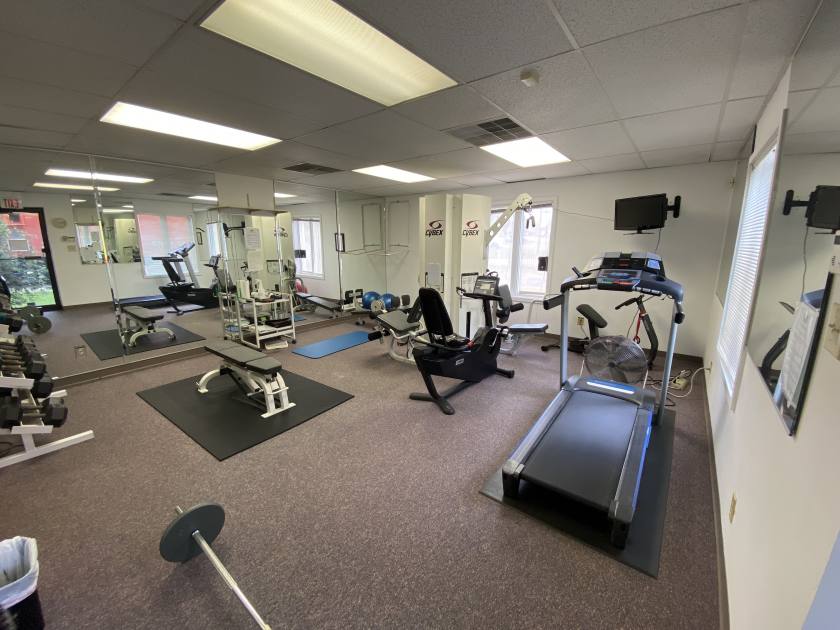
Additional Photos

Listing Agents

Brad Kitchen
O: 614-398-4215
mnapalo@alterrare.com
O: 614-398-4215
mnapalo@alterrare.com
While we strive to provide the most accurate information, all listing information, and demographic data, is provided by third-parties. As such, MyEListing will not be responsible for the accuracy of the information. It is strongly recommended that you verify all information with the listing agent, and any relevant agencies, prior to making any decisions.