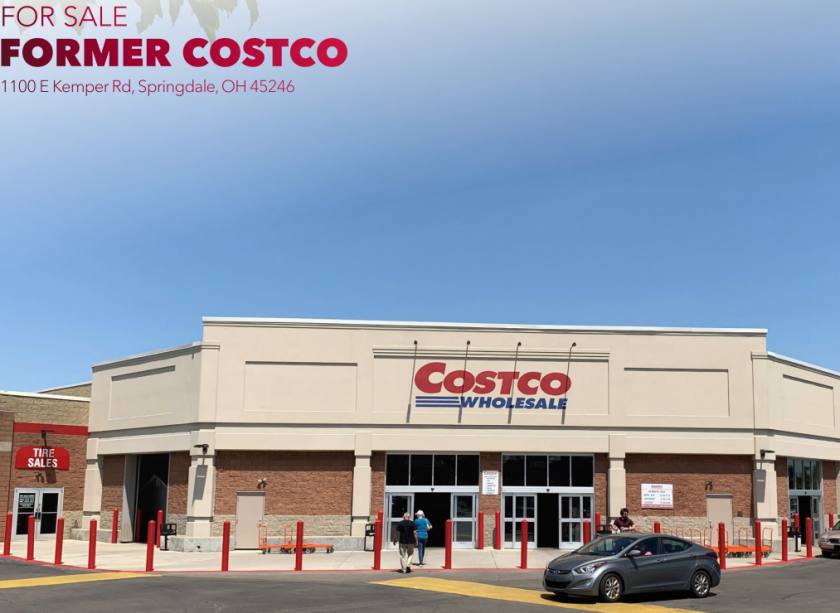
Retail Space
1100 East Kemper Road Springdale, OH 45246
1100 East Kemper Road Springdale, OH 45246
Details & Description
Property Highlights
• Contact Broker For More Details
• Contact Broker For More Details
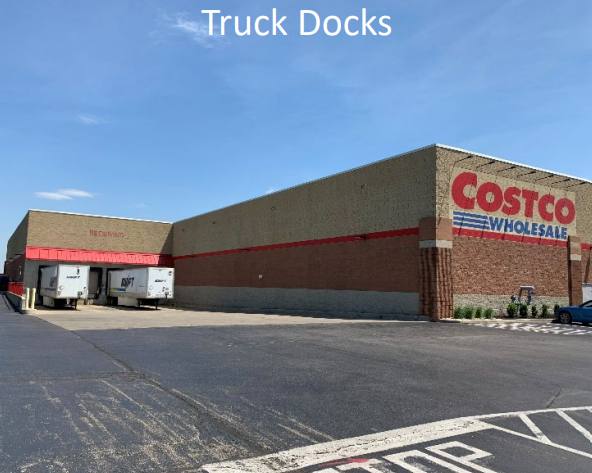
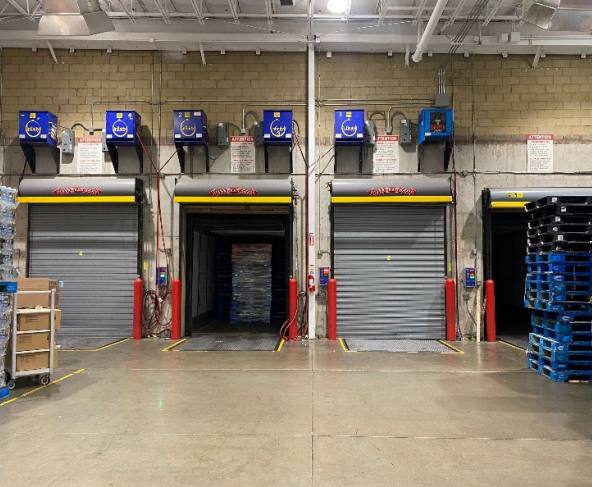
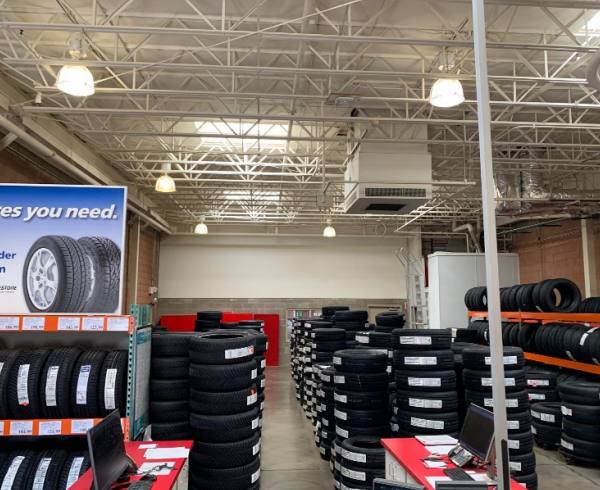
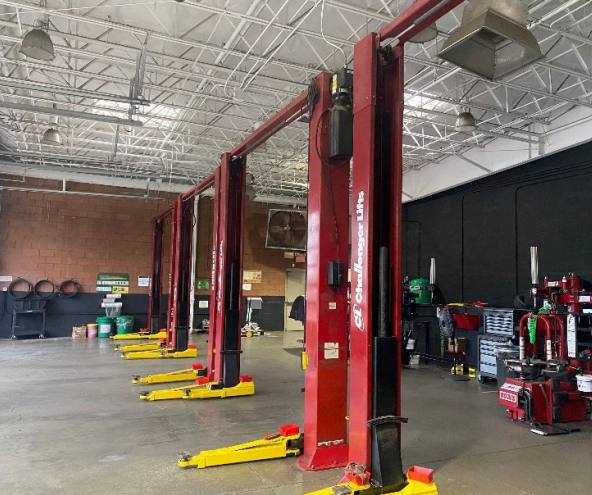
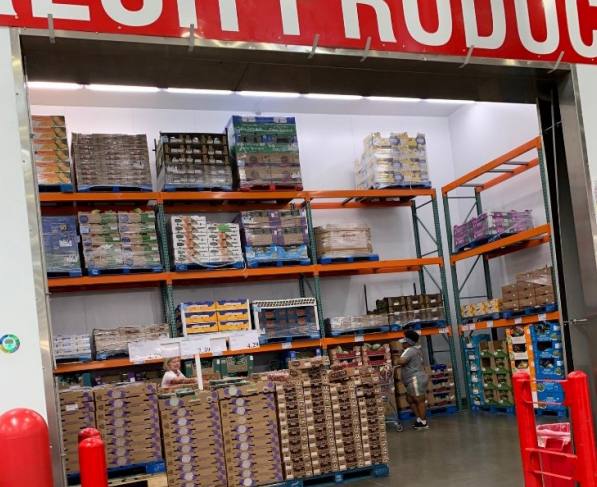
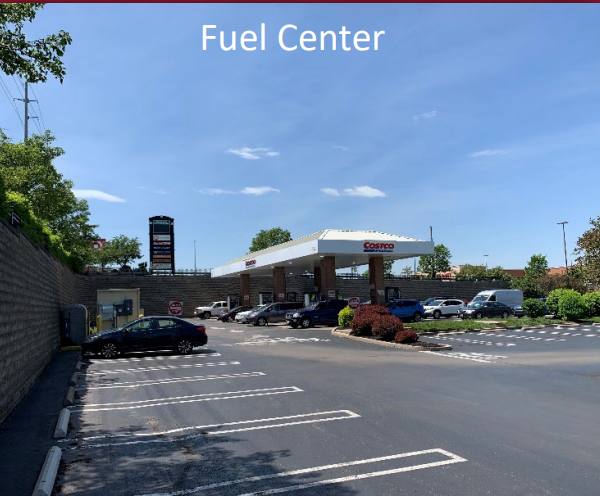
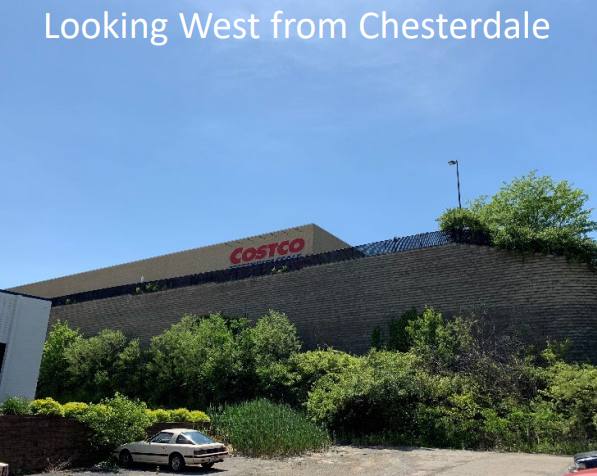
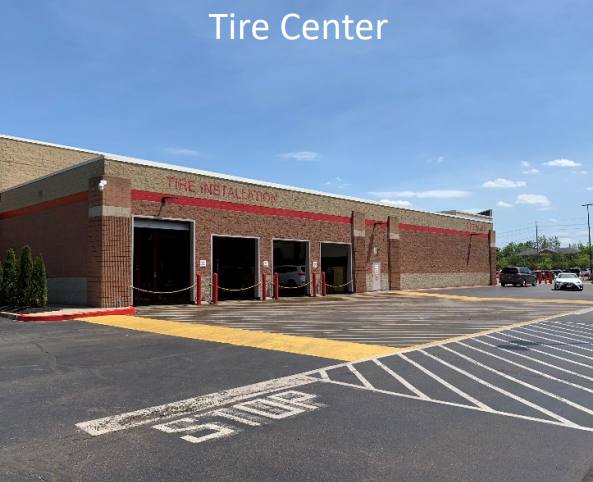
Additional Photos

Listing Agents

Stewart Devitt
O: 513-588-1115
stewart.devitt@lee-associates.com
O: 513-588-1115
stewart.devitt@lee-associates.com

George Flynn
O: 513-588-1126
M: 513-325-9333
gflynn@lee-associates.com
O: 513-588-1126
M: 513-325-9333
gflynn@lee-associates.com

Dan McDonald
O: 513-588-1113
M: 513-608-2984
dan.mcdonald@lee-associates.com
O: 513-588-1113
M: 513-608-2984
dan.mcdonald@lee-associates.com
While we strive to provide the most accurate information, all listing information, and demographic data, is provided by third-parties. As such, MyEListing will not be responsible for the accuracy of the information. It is strongly recommended that you verify all information with the listing agent, and any relevant agencies, prior to making any decisions.