Retail Space
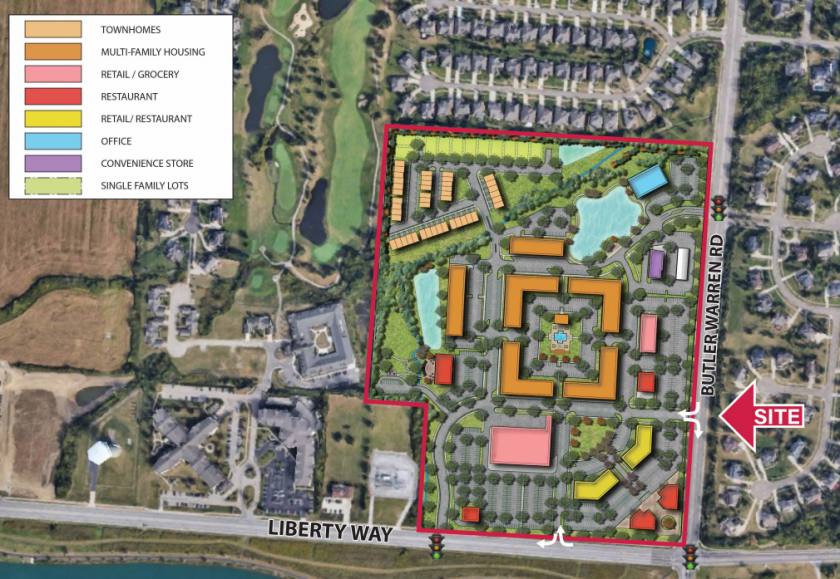
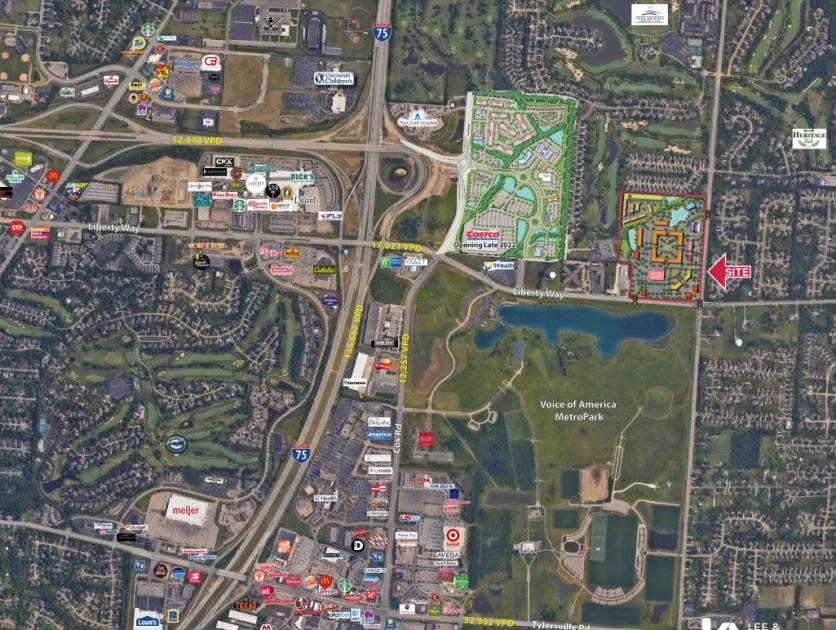
Corner of Liberty Way Butler Warren Rd Mason, OH 45040
Corner of Liberty Way Butler Warren Rd Mason, OH 45040
Details & Description
Property Highlights
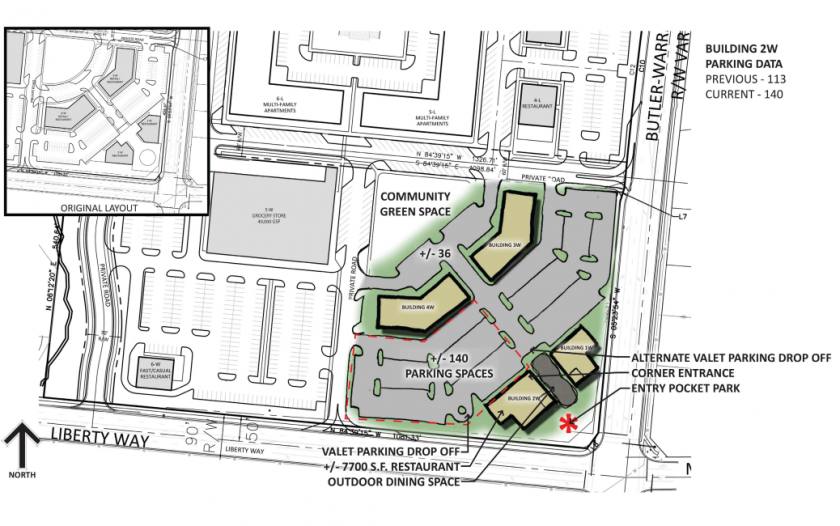
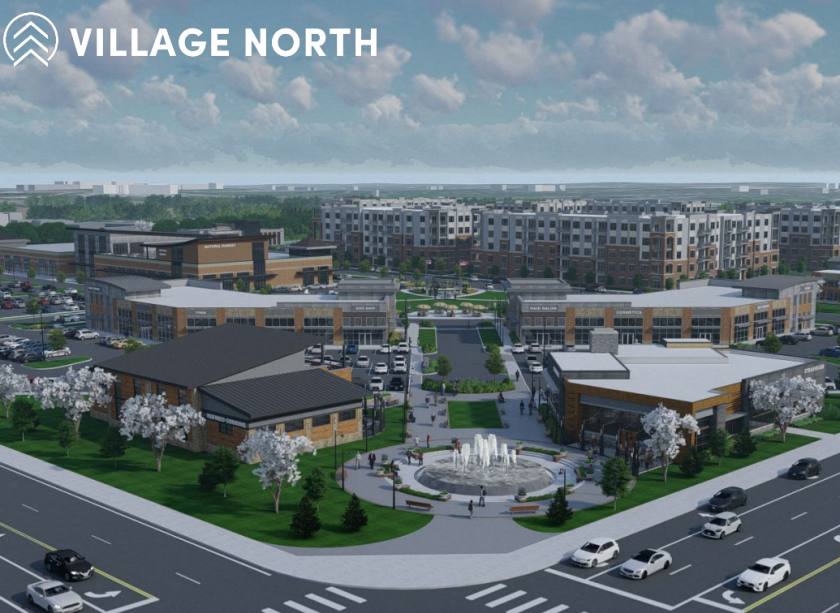
- • Projected Opening Fall 2025
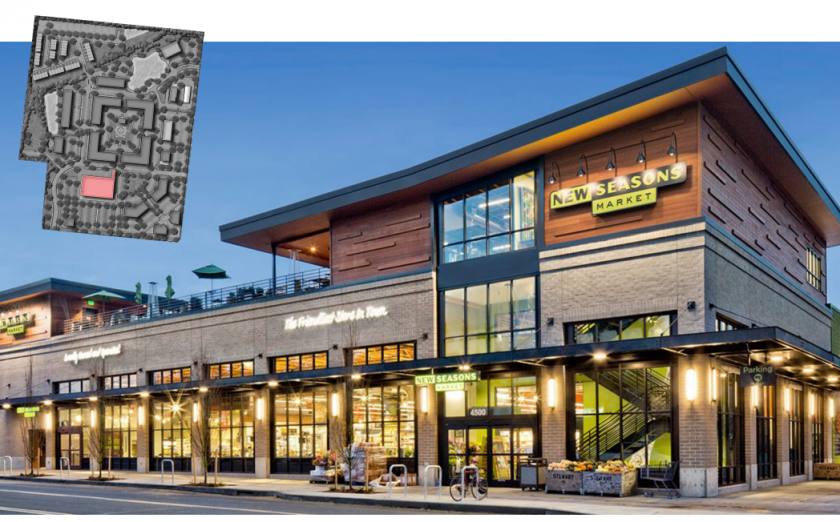
- • 140,000 SF of Retail Space Available
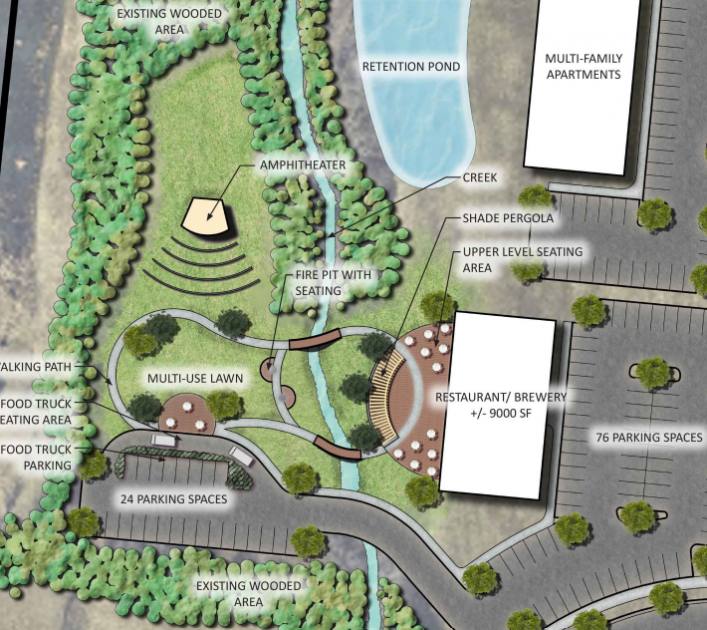
- • 450 Multi Family Units and Townhomes Planned
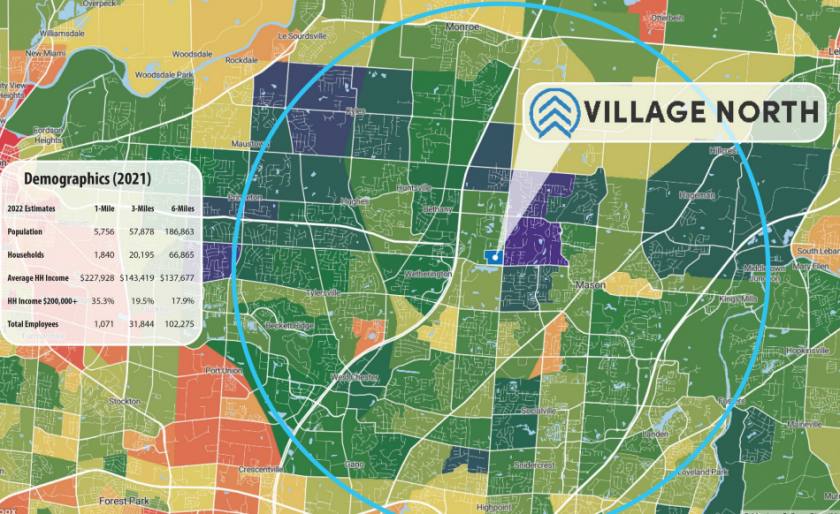
- • Great Visibility, Access, and High Incomes
- • Butler County - Liberty Township - No Earnings Tax
Additional Photos
Listing Agents

George Flynn
O: 513-588-1126
M: 513-325-9333
gflynn@lee-associates.com
O: 513-588-1126
M: 513-325-9333
gflynn@lee-associates.com

TC Bartoszek
O: 513-588-1840
M: 513-535-0563
tcbartoszek@lee-associates.com
O: 513-588-1840
M: 513-535-0563
tcbartoszek@lee-associates.com

Molly Hoffman
O: 513-588-1843
mhoffman@lee-associates.com
O: 513-588-1843
mhoffman@lee-associates.com
While we strive to provide the most accurate information, all listing information, and demographic data, is provided by third-parties. As such, MyEListing will not be responsible for the accuracy of the information. It is strongly recommended that you verify all information with the listing agent, and any relevant agencies, prior to making any decisions.