Commercial Land
SR 22 SR 48 Hopkinsville, OH 45039
SR 22 SR 48 Hopkinsville, OH 45039

Details & Description
Property Highlights
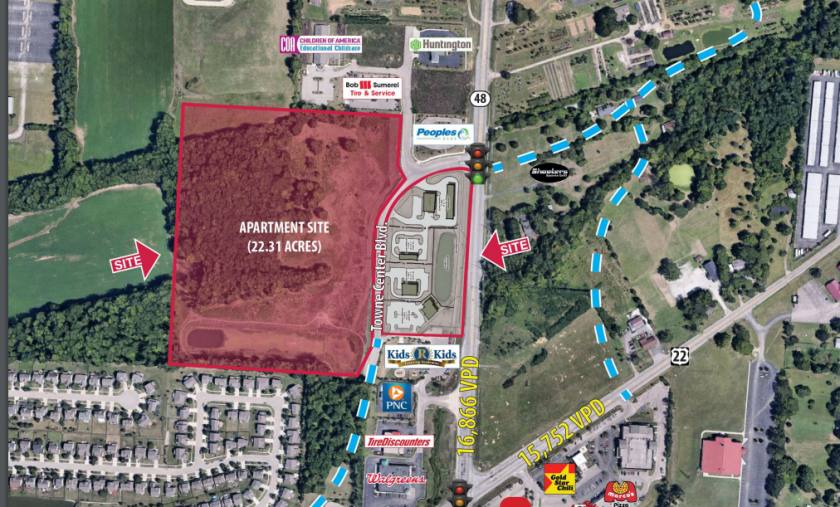
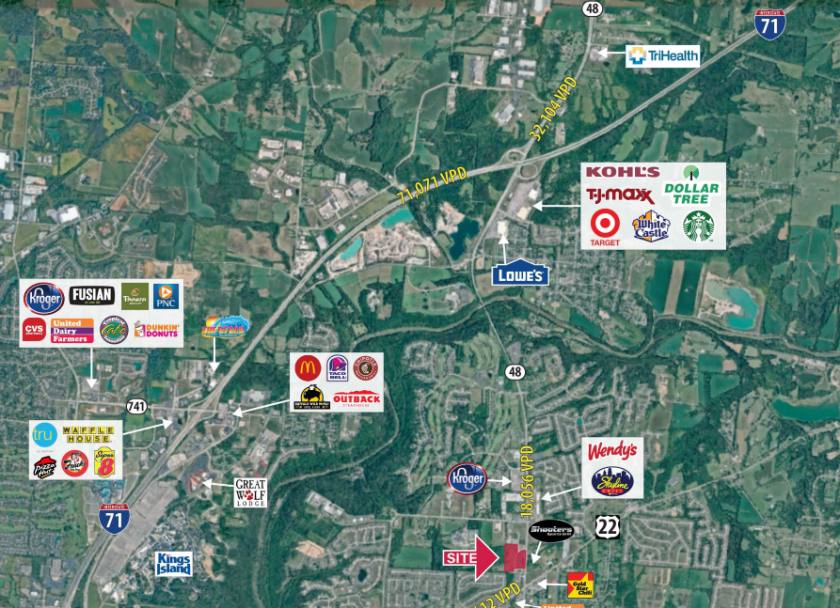
- • Rapidly growing, high-income area
- • Zoned: B-2, General Business District
- • Surrounded by national and regional retailers
- • 22 miles northeast of Downtown Cincinnati
- • Traffic light to SR 48
- • Planned Road Improvements on SR 48
Additional Photos

Listing Agents

George Flynn
O: 513-588-1126
M: 513-325-9333
gflynn@lee-associates.com
O: 513-588-1126
M: 513-325-9333
gflynn@lee-associates.com

Chris Nachtrab
O: 513-588-1841
M: 513-604-1899
cnachtrab@lee-associates.com
O: 513-588-1841
M: 513-604-1899
cnachtrab@lee-associates.com
While we strive to provide the most accurate information, all listing information, and demographic data, is provided by third-parties. As such, MyEListing will not be responsible for the accuracy of the information. It is strongly recommended that you verify all information with the listing agent, and any relevant agencies, prior to making any decisions.


