Office Space
3505 Columbia Parkway Cincinnati, OH 45226
3505 Columbia Parkway Cincinnati, OH 45226
Details & Description
Property Highlights
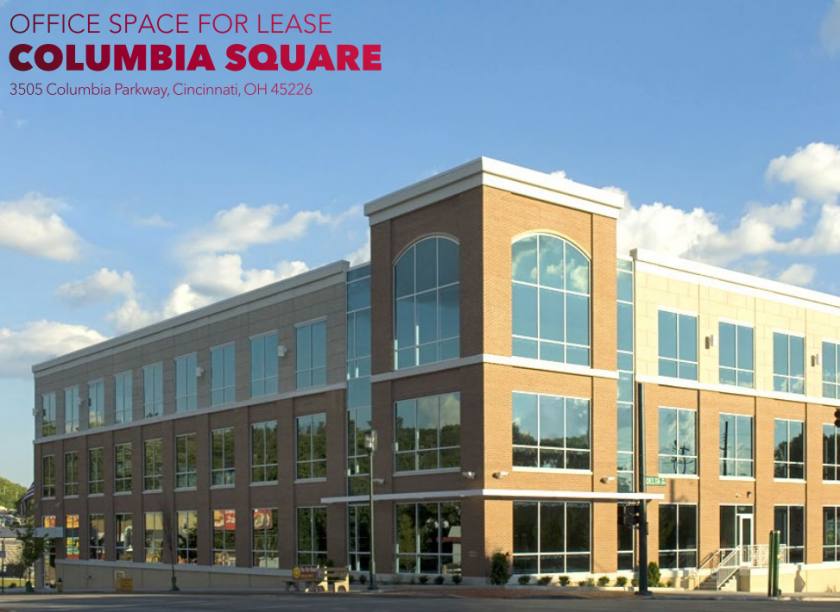
- • Class A Office Building
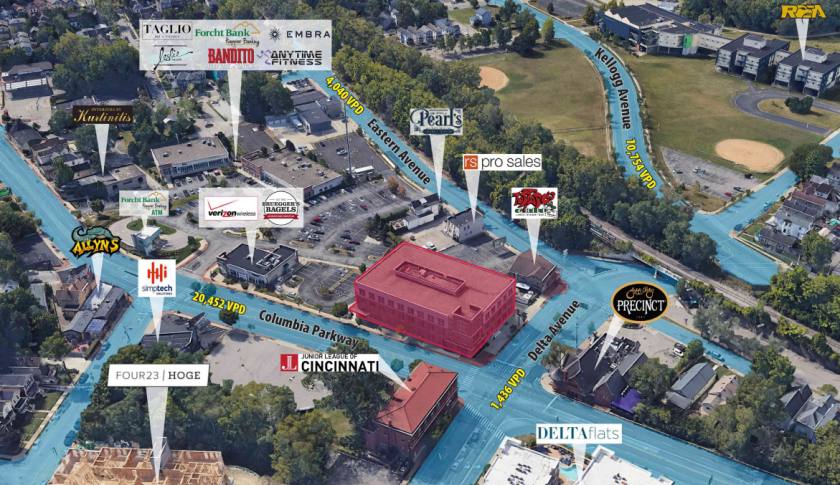
- • On Columbia Parkway with prime visibility
- • Free parking
- • Minutes from downtown
- • Numerous walkable amenities
- • Impressive space sure to improve company culture
Additional Photos

Listing Agents

Dan McDonald
O: 513-588-1113
M: 513-608-2984
dan.mcdonald@lee-associates.com
O: 513-588-1113
M: 513-608-2984
dan.mcdonald@lee-associates.com

Stewart Devitt
O: 513-588-1115
stewart.devitt@lee-associates.com
O: 513-588-1115
stewart.devitt@lee-associates.com
While we strive to provide the most accurate information, all listing information, and demographic data, is provided by third-parties. As such, MyEListing will not be responsible for the accuracy of the information. It is strongly recommended that you verify all information with the listing agent, and any relevant agencies, prior to making any decisions.


