Commercial Land
W National Road Englewood, OH 45322
W National Road Englewood, OH 45322
Details & Description
Property Highlights
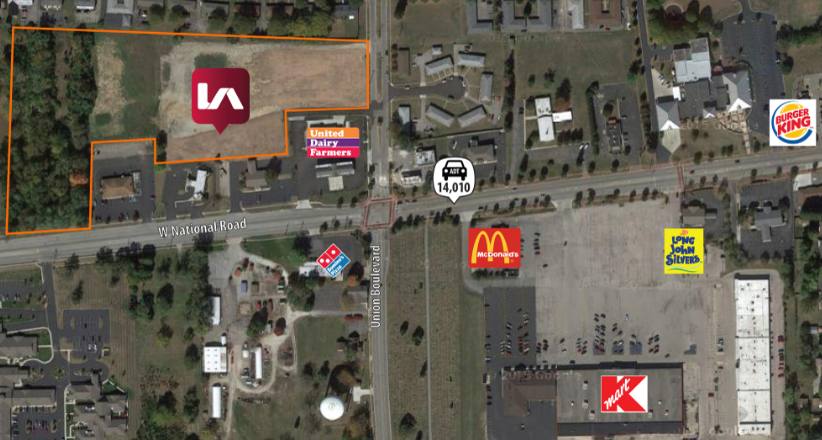
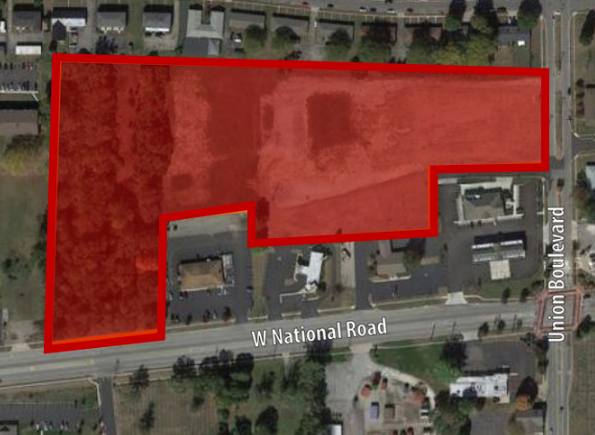
• Property has two curb cuts with 475' of frontage on W National Rd and Union Boulevard.
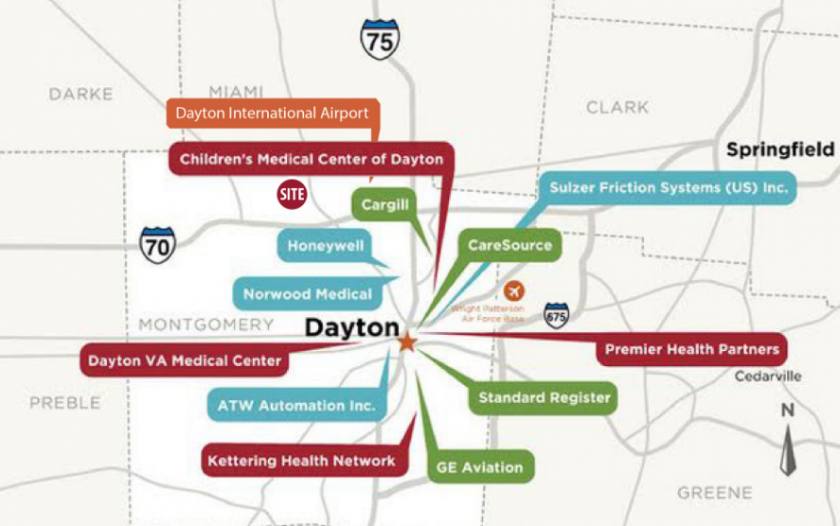
• Close proximity to Wright-Patterson Air Force Base as well as I-75,I-70 and I-675.
Listing Agents

Stewart Devitt
O: 513-588-1115
stewart.devitt@lee-associates.com
O: 513-588-1115
stewart.devitt@lee-associates.com

Dan McDonald
O: 513-588-1113
M: 513-608-2984
dan.mcdonald@lee-associates.com
O: 513-588-1113
M: 513-608-2984
dan.mcdonald@lee-associates.com
While we strive to provide the most accurate information, all listing information, and demographic data, is provided by third-parties. As such, MyEListing will not be responsible for the accuracy of the information. It is strongly recommended that you verify all information with the listing agent, and any relevant agencies, prior to making any decisions.