Industrial Properties
120 Cole Avenue Akron, OH 44301
120 Cole Avenue Akron, OH 44301
Details & Description
Property Highlights
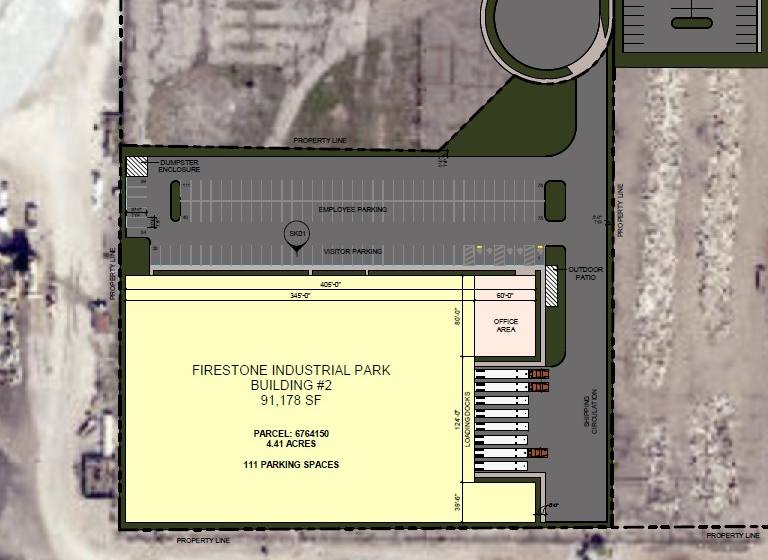
• Phase II in Firestone Industrial Park
• Under Construction!
Listing Agents

Jeffrey A. Calig
O: 216-455-0910
M: 216-496-3143
jcalig@naipvc.com
O: 216-455-0910
M: 216-496-3143
jcalig@naipvc.com

Scott Raskow
O: 330-535-2661
M: 330-608-5172
scott.raskow@naipvc.com
O: 330-535-2661
M: 330-608-5172
scott.raskow@naipvc.com

David Hexter
O: 216-455-0890
M: 216-469-6979
dhexter@naipvc.com
O: 216-455-0890
M: 216-469-6979
dhexter@naipvc.com
While we strive to provide the most accurate information, all listing information, and demographic data, is provided by third-parties. As such, MyEListing will not be responsible for the accuracy of the information. It is strongly recommended that you verify all information with the listing agent, and any relevant agencies, prior to making any decisions.


