Commercial Land
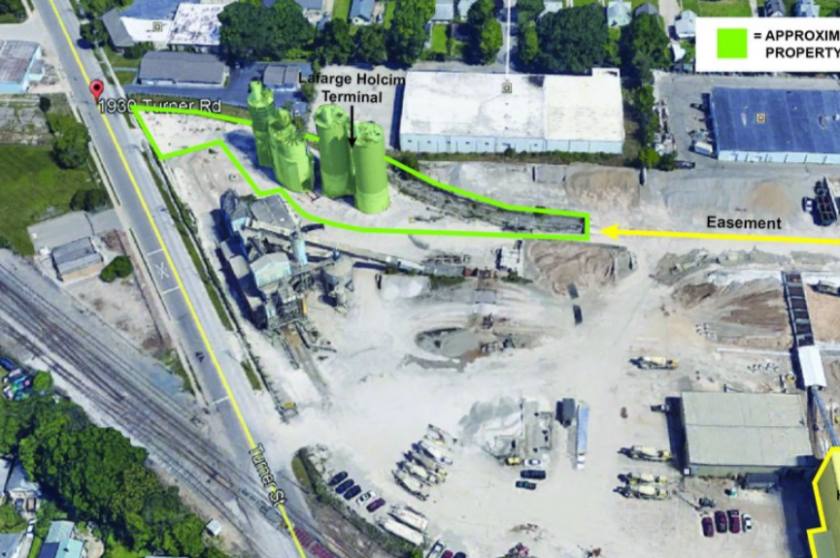
1930 Turner Road Lansing, MI 48906
1930 Turner Road Lansing, MI 48906

Details & Description
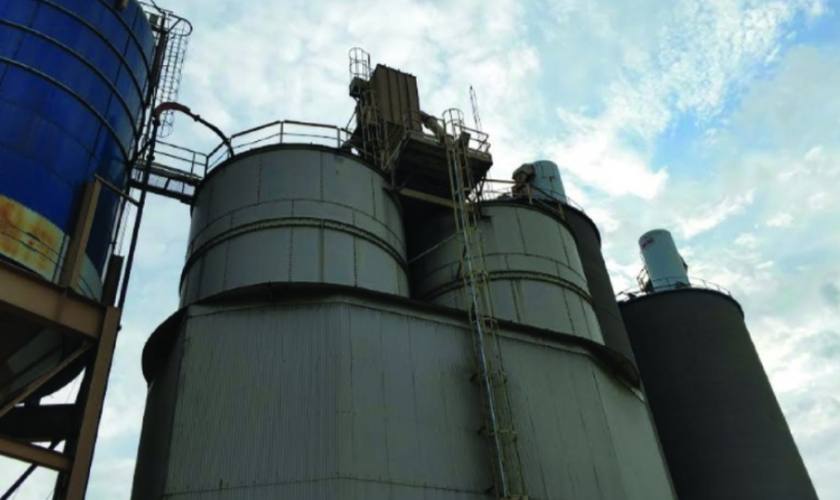
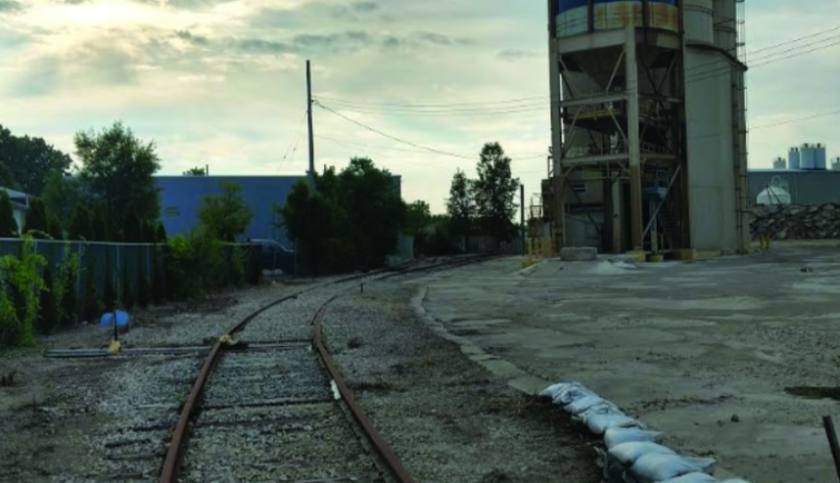
Additional Photos

Listing Agents

John Arthurs
O: 248-663-0506
M: 248-563-3225
johna@pacommercial.com
O: 248-663-0506
M: 248-563-3225
johna@pacommercial.com
While we strive to provide the most accurate information, all listing information, and demographic data, is provided by third-parties. As such, MyEListing will not be responsible for the accuracy of the information. It is strongly recommended that you verify all information with the listing agent, and any relevant agencies, prior to making any decisions.


