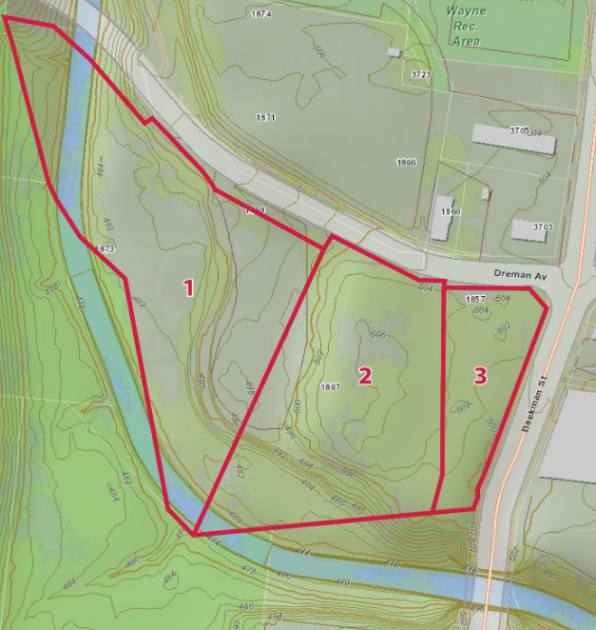
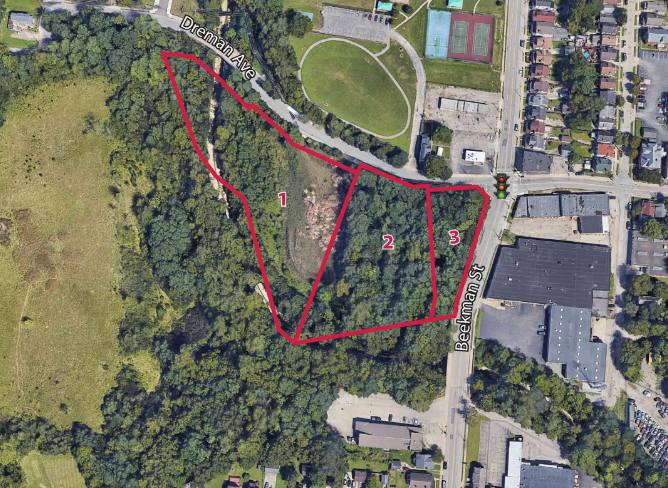
1-Mile | 3-Miles | 5-Miles | ||
---|---|---|---|---|
Total Population | 11,315 | 110,106 | 317,352 | |
Population Median Age | 31 | 32 | 36 | |
Population by Age | 0-9 Yrs | 2465 (21%) | 16173 (14%) | 42829 (13%) |
10-19 Yrs | 1332 (11%) | 18420 (16%) | 43613 (13%) | |
20-29 Yrs | 2193 (19%) | 25028 (22%) | 57229 (18%) | |
30-39 Yrs | 1790 (15%) | 14572 (13%) | 45012 (14%) | |
40-49 Yrs | 1174 (10%) | 10693 (9%) | 32707 (10%) | |
50-59 Yrs | 928 (8%) | 10376 (9%) | 37806 (11%) | |
60-69 Yrs | 973 (8%) | 8667 (7%) | 32771 (10%) | |
70+ Yrs | 461 (4%) | 6178 (5%) | 25385 (7%) | |
Median HH Income | $26,012 | $34,288 | $42,600 | |
Total Household Income | < 24K | 2453 (48%) | 17828 (38%) | 43311 (31%) |
25-49K | 1085 (21%) | 12102 (26%) | 34155 (24%) | |
50-74K | 596 (11%) | 6621 (14%) | 22185 (16%) | |
75-99K | 209 (4%) | 3473 (7%) | 14018 (10%) | |
100-199K | 613 (12%) | 4810 (10%) | 18814 (13%) | |
200K+ | 63 (1%) | 1242 (2%) | 4877 (3%) | |
Highest Education Level | No Diploma | 1069 | 8176 | 23460 |
Diploma or GED | 1634 | 16687 | 59167 | |
Some College | 1572 | 12334 | 41044 | |
Assoc. Degree | 559 | 4666 | 15861 | |
Bachelors Degree | 979 | 10878 | 38276 | |
Higher Degree | 711 | 8379 | 24578 | |
Total Housing Units | 5,959 | 54,882 | 159,505 | |
--Owner-Occupied | 1,273 | 14,123 | 59,775 | |
--Renter-Occupied | 3,745 | 31,953 | 77,586 | |
Owner-Occupied Values | < 100K | 453 | 5320 | 20871 |
100-199K | 446 | 5551 | 25643 | |
200-299K | 237 | 1696 | 6876 | |
300-399K | 105 | 743 | 2667 | |
400-499K | 19 | 411 | 1353 | |
500K+ | 12 | 402 | 2365 | |
Total Working Age Population | 7,946 | 86,323 | 251,783 | |
In Work Force | 5,218 | 56,361 | 165,742 | |
Not In Work Force | 2,728 | 29,962 | 86,042 | |
Workforce Employed | 4,432 | 50,977 | 152,907 | |
Workforce Unemployed | 786 | 5,370 | 12,710 | |
Civlian Workforce | 5,218 | 56,347 | 165,617 | |
Military Workforce | 0 | 14 | 124 | |
Total Households | 5,018 | 46,076 | 137,361 | |
Family Households | 2,711 | 20,799 | 67,042 | |
Non-Family Households | 2,307 | 25,277 | 70,319 | |
Married Couple | 816 | 9,366 | 35,898 | |
Other Family | 1,895 | 11,433 | 31,144 | |
Married w/Child | 246 | 3,394 | 12,174 | |
Single Male w/Child | 146 | 1,095 | 3,194 | |
Single Female w/Child | 1,375 | 6,546 | 15,602 |
Population Change Last Two Decades - Plus Projection
2000 | % | 2010 | % | 2020 | % | 2030 | |
---|---|---|---|---|---|---|---|
Kentucky | 4,041,769 | +7 | 4,339,367 | +4 | 4,533,464 | +4 | 4,726,382 |
Kenton County | 151,464 | +5 | 159,720 | +6 | 169,386 | +4 | 176,039 |
Campbell County | 88,616 | +2 | 90,336 | +3 | 92,898 | +1 | 93,473 |
Ohio | 11,353,140 | +2 | 11,536,504 | 0 | 11,574,870 | 0 | 11,615,100 |
Hamilton County | 845,303 | -5 | 802,374 | -1 | 790,600 | -1 | 785,900 |
Total Working Age Population:
Total Households:
Total Working Age Population:
Total Households:
Total Working Age Population:
Total Households: