Multifamily Housing
1017 - 1114 E Grand Blvd Detroit, MI 48207
1017 - 1114 E Grand Blvd Detroit, MI 48207

Details & Description
Property Highlights
- • 12 total units - priced for rehab
- • Expected annual gross income: $168,000
- • Minutes from Downtown Detroit
- • AirBnB rental capacity
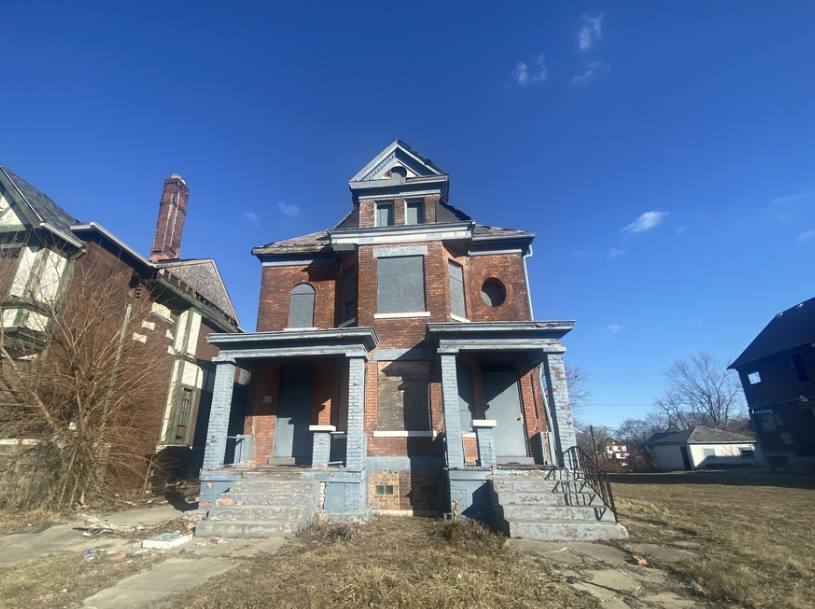
Additional Photos


Listing Agents

Brianna Johnston
O: 248-663-0507
M: 419-605-8579
brianna@pacommercial.com
O: 248-663-0507
M: 419-605-8579
brianna@pacommercial.com
While we strive to provide the most accurate information, all listing information, and demographic data, is provided by third-parties. As such, MyEListing will not be responsible for the accuracy of the information. It is strongly recommended that you verify all information with the listing agent, and any relevant agencies, prior to making any decisions.


