Commercial Land
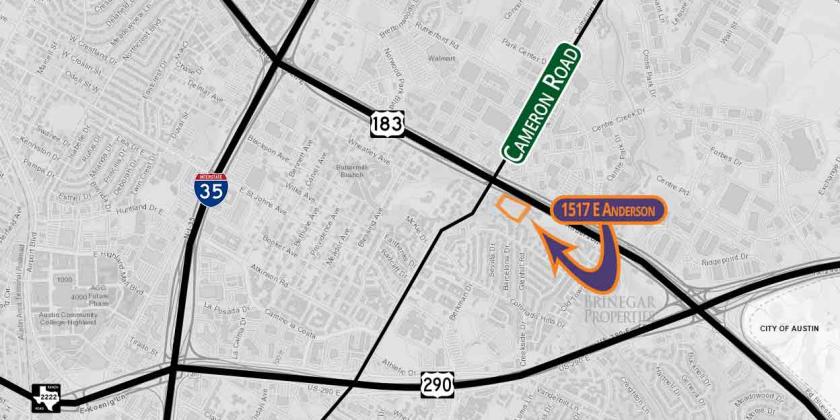
1517 East Anderson Lane Austin, TX 78752
1517 East Anderson Lane Austin, TX 78752

Details & Description
Property Highlights
- • NEW PRICE!
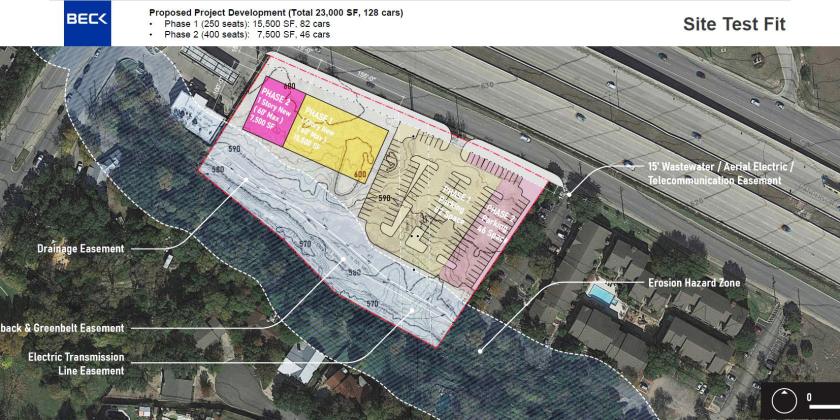
- • 500 ft of frontage on Hwy 183 access road
- • $2,500,000
Listing Agents

Megan Ford
O: 512-940-0188
M: 512-645-2908
megan@512texas.com
O: 512-940-0188
M: 512-645-2908
megan@512texas.com
While we strive to provide the most accurate information, all listing information, and demographic data, is provided by third-parties. As such, MyEListing will not be responsible for the accuracy of the information. It is strongly recommended that you verify all information with the listing agent, and any relevant agencies, prior to making any decisions.