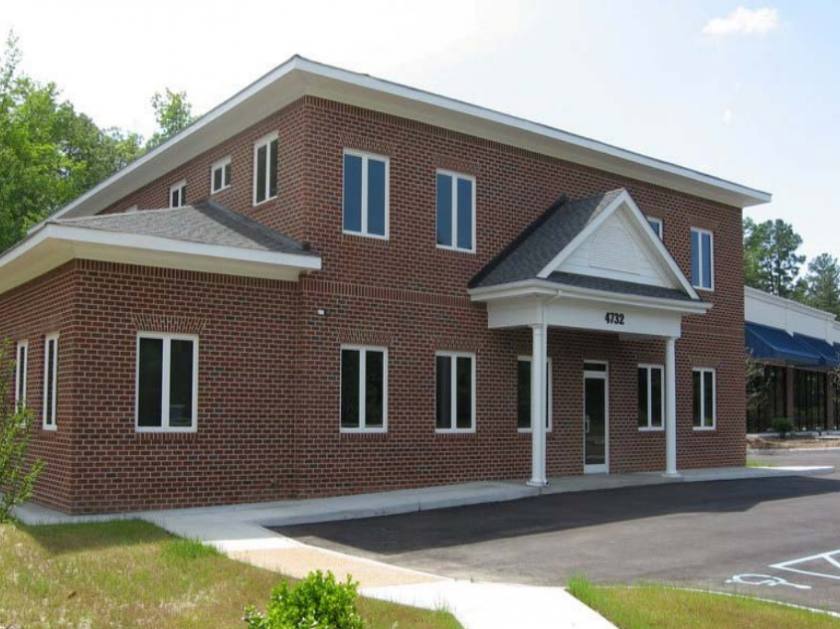
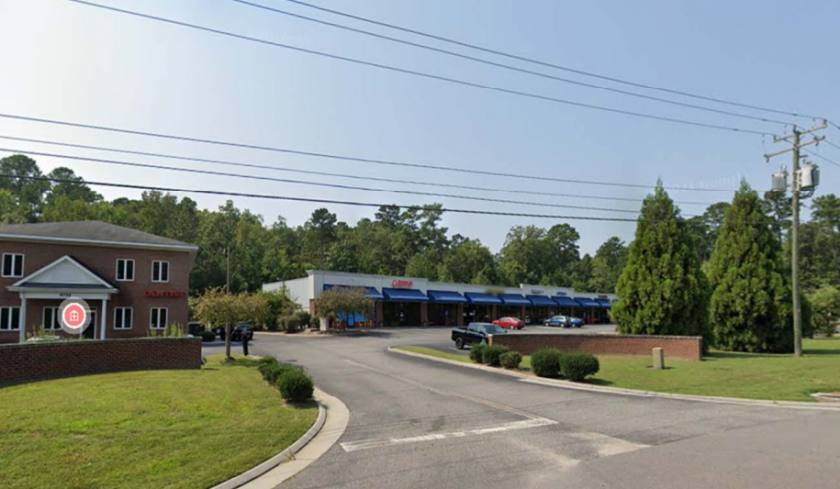
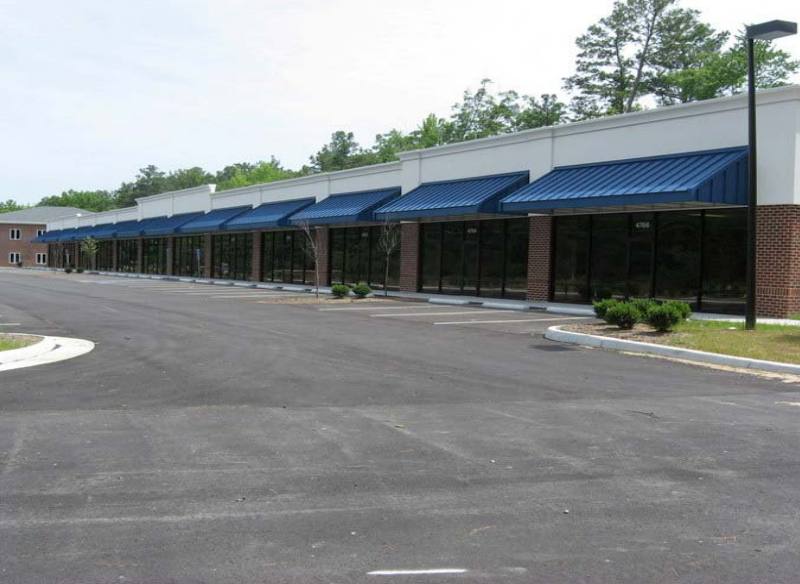
1-Mile | 3-Miles | 5-Miles | ||
---|---|---|---|---|
Total Population | 483 | 5,021 | 13,490 | |
Population Median Age | 43 | 39 | 42 | |
Population by Age | 0-9 Yrs | 64 (13%) | 669 (13%) | 1558 (11%) |
10-19 Yrs | 53 (10%) | 710 (14%) | 1701 (12%) | |
20-29 Yrs | 31 (6%) | 468 (9%) | 1349 (10%) | |
30-39 Yrs | 74 (15%) | 733 (14%) | 1833 (13%) | |
40-49 Yrs | 53 (10%) | 595 (11%) | 1622 (12%) | |
50-59 Yrs | 73 (15%) | 641 (12%) | 1769 (13%) | |
60-69 Yrs | 54 (11%) | 554 (11%) | 1664 (12%) | |
70+ Yrs | 81 (16%) | 651 (12%) | 1993 (14%) | |
Median HH Income | $66,884 | $71,685 | $72,196 | |
Total Household Income | < 24K | 29 (17%) | 237 (13%) | 642 (12%) |
25-49K | 32 (18%) | 336 (18%) | 965 (19%) | |
50-74K | 38 (22%) | 379 (20%) | 1033 (20%) | |
75-99K | 25 (14%) | 317 (17%) | 870 (17%) | |
100-199K | 36 (21%) | 438 (24%) | 1305 (25%) | |
200K+ | 10 (5%) | 98 (5%) | 248 (4%) | |
Highest Education Level | No Diploma | 59 | 412 | 994 |
Diploma or GED | 116 | 1104 | 3084 | |
Some College | 94 | 960 | 2572 | |
Assoc. Degree | 24 | 233 | 888 | |
Bachelors Degree | 46 | 522 | 1547 | |
Higher Degree | 16 | 206 | 626 | |
Total Housing Units | 188 | 2,031 | 5,698 | |
--Owner-Occupied | 155 | 1,536 | 4,089 | |
--Renter-Occupied | 16 | 269 | 974 | |
Owner-Occupied Values | < 100K | 6 | 82 | 207 |
100-199K | 42 | 392 | 1011 | |
200-299K | 58 | 606 | 1691 | |
300-399K | 37 | 328 | 681 | |
400-499K | 7 | 76 | 277 | |
500K+ | 4 | 52 | 222 | |
Total Working Age Population | 381 | 3,803 | 10,692 | |
In Work Force | 227 | 2,446 | 6,672 | |
Not In Work Force | 155 | 1,357 | 4,021 | |
Workforce Employed | 217 | 2,283 | 6,291 | |
Workforce Unemployed | 6 | 88 | 234 | |
Civlian Workforce | 223 | 2,371 | 6,525 | |
Military Workforce | 4 | 76 | 147 | |
Total Households | 170 | 1,805 | 5,063 | |
Family Households | 130 | 1,309 | 3,503 | |
Non-Family Households | 40 | 496 | 1,560 | |
Married Couple | 105 | 1,031 | 2,705 | |
Other Family | 26 | 278 | 798 | |
Married w/Child | 41 | 419 | 1,010 | |
Single Male w/Child | 4 | 48 | 104 | |
Single Female w/Child | 5 | 98 | 243 |
Population Change Last Two Decades - Plus Projection
2000 | % | 2010 | % | 2020 | % | 2030 | |
---|---|---|---|---|---|---|---|
Virginia | 7,078,515 | +13 | 8,001,024 | +8 | 8,655,021 | +8 | 9,331,666 |
Gloucester County | 34,780 | +6 | 36,858 | +1 | 37,343 | +2 | 38,181 |
Total Working Age Population:
Total Households:
Total Working Age Population:
Total Households:
Total Working Age Population:
Total Households: