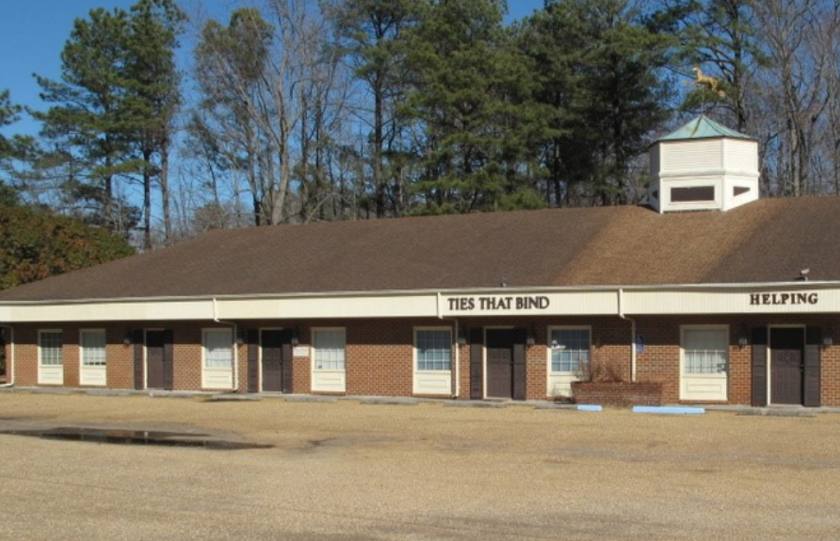
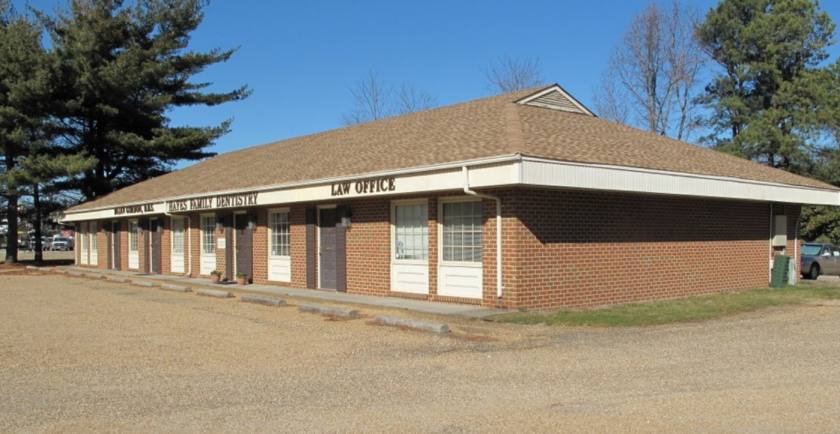
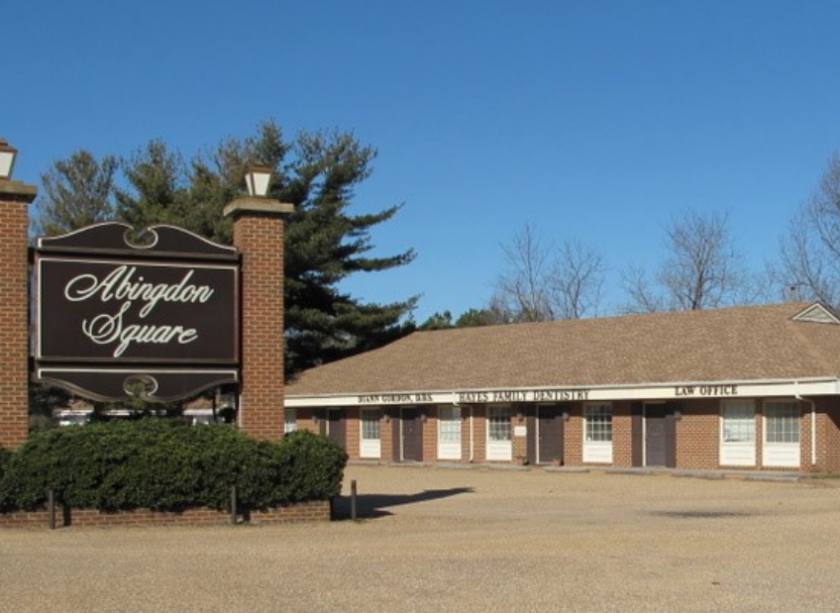
1-Mile | 3-Miles | 5-Miles | ||
---|---|---|---|---|
Total Population | 1,423 | 8,738 | 16,141 | |
Population Median Age | 42 | 40 | 39 | |
Population by Age | 0-9 Yrs | 143 (10%) | 972 (11%) | 1830 (11%) |
10-19 Yrs | 167 (11%) | 1170 (13%) | 2030 (12%) | |
20-29 Yrs | 191 (13%) | 1037 (11%) | 2436 (15%) | |
30-39 Yrs | 240 (16%) | 1196 (13%) | 2137 (13%) | |
40-49 Yrs | 92 (6%) | 902 (10%) | 1709 (10%) | |
50-59 Yrs | 209 (14%) | 1285 (14%) | 2224 (13%) | |
60-69 Yrs | 180 (12%) | 1191 (13%) | 2081 (12%) | |
70+ Yrs | 203 (14%) | 985 (11%) | 1692 (10%) | |
Median HH Income | $59,631 | $60,172 | $62,876 | |
Total Household Income | < 24K | 81 (13%) | 405 (11%) | 852 (13%) |
25-49K | 142 (24%) | 963 (27%) | 1567 (25%) | |
50-74K | 149 (25%) | 746 (21%) | 1134 (18%) | |
75-99K | 109 (18%) | 568 (16%) | 922 (15%) | |
100-199K | 99 (16%) | 670 (19%) | 1325 (21%) | |
200K+ | 8 (1%) | 120 (3%) | 306 (5%) | |
Highest Education Level | No Diploma | 96 | 653 | 1227 |
Diploma or GED | 299 | 1762 | 3111 | |
Some College | 344 | 1717 | 2861 | |
Assoc. Degree | 161 | 590 | 989 | |
Bachelors Degree | 98 | 762 | 1499 | |
Higher Degree | 46 | 525 | 1108 | |
Total Housing Units | 650 | 3,804 | 6,714 | |
--Owner-Occupied | 435 | 2,545 | 4,388 | |
--Renter-Occupied | 154 | 927 | 1,717 | |
Owner-Occupied Values | < 100K | 14 | 185 | 307 |
100-199K | 161 | 743 | 1215 | |
200-299K | 189 | 1030 | 1678 | |
300-399K | 29 | 379 | 707 | |
400-499K | 39 | 149 | 275 | |
500K+ | 4 | 59 | 207 | |
Total Working Age Population | 1,168 | 6,925 | 12,968 | |
In Work Force | 664 | 4,147 | 8,397 | |
Not In Work Force | 504 | 2,778 | 4,571 | |
Workforce Employed | 606 | 3,767 | 6,981 | |
Workforce Unemployed | 34 | 181 | 270 | |
Civlian Workforce | 640 | 3,948 | 7,250 | |
Military Workforce | 24 | 200 | 1,147 | |
Total Households | 589 | 3,472 | 6,105 | |
Family Households | 392 | 2,280 | 4,136 | |
Non-Family Households | 197 | 1,193 | 1,969 | |
Married Couple | 282 | 1,736 | 3,055 | |
Other Family | 109 | 544 | 1,081 | |
Married w/Child | 101 | 515 | 1,008 | |
Single Male w/Child | 20 | 91 | 111 | |
Single Female w/Child | 28 | 190 | 446 |
Population Change Last Two Decades - Plus Projection
2000 | % | 2010 | % | 2020 | % | 2030 | |
---|---|---|---|---|---|---|---|
Virginia | 7,078,515 | +13 | 8,001,024 | +8 | 8,655,021 | +8 | 9,331,666 |
York County | 56,297 | +16 | 65,464 | +6 | 69,582 | +8 | 75,492 |
Gloucester County | 34,780 | +6 | 36,858 | +1 | 37,343 | +2 | 38,181 |
Total Working Age Population:
Total Households:
Total Working Age Population:
Total Households:
Total Working Age Population:
Total Households: