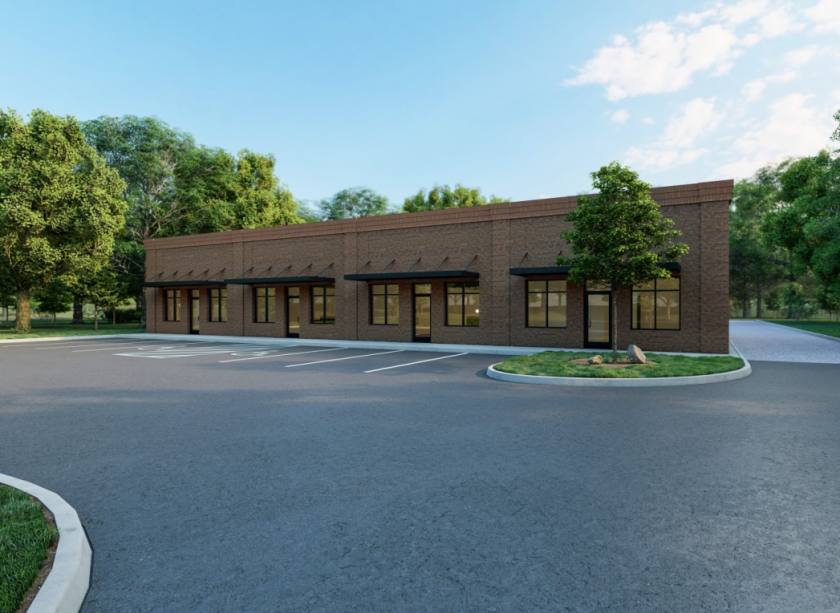
Flex-Office-Warehouse
136 Tewning Road Williamsburg, VA 23188
136 Tewning Road Williamsburg, VA 23188
Details & Description
Property Highlights
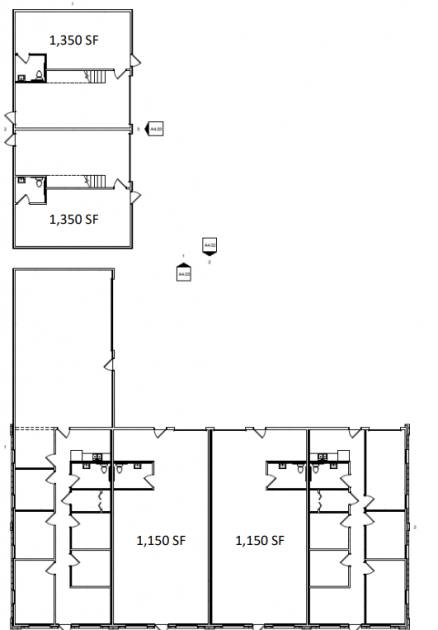
• Available unit sizes: 1,150 square feet, Rear building 800 square feet and mezzanine, Max. contiguous 3,450 square
• M-1 Light Industrial zoning, wide variety of commercial and manufacturing uses allowed by right
Listing Agents

Mac Houtz
O: 757-245-1541
M: 757-926-5066
mhoutz@druckerandfalk.com
O: 757-245-1541
M: 757-926-5066
mhoutz@druckerandfalk.com
While we strive to provide the most accurate information, all listing information, and demographic data, is provided by third-parties. As such, MyEListing will not be responsible for the accuracy of the information. It is strongly recommended that you verify all information with the listing agent, and any relevant agencies, prior to making any decisions.