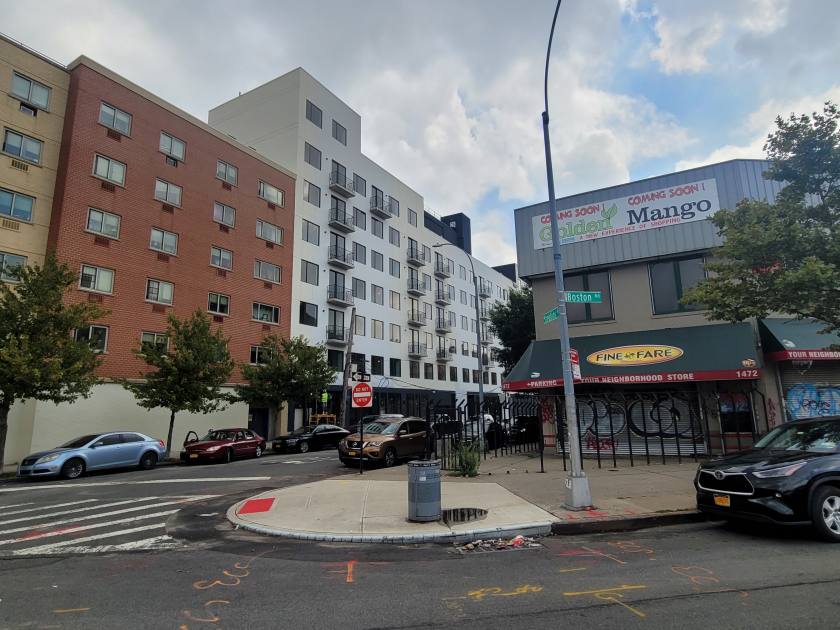
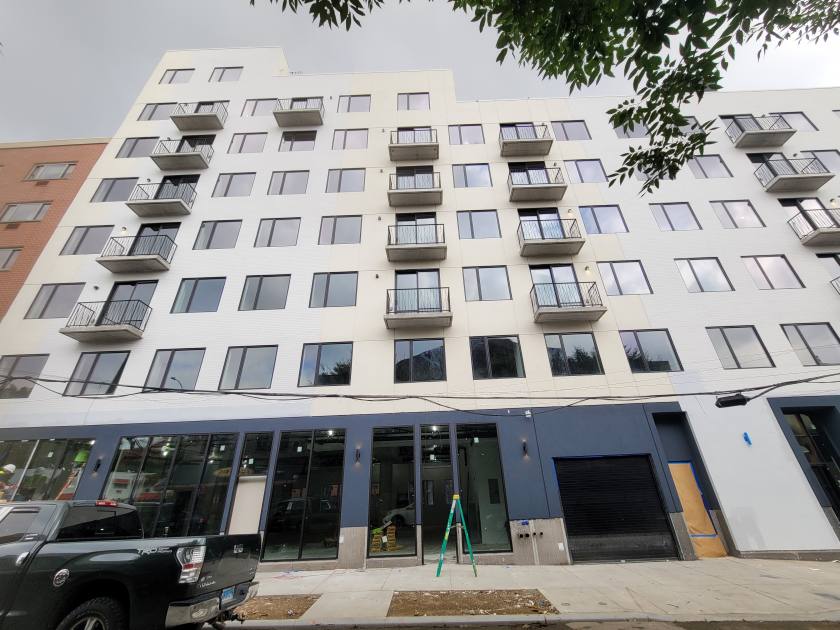
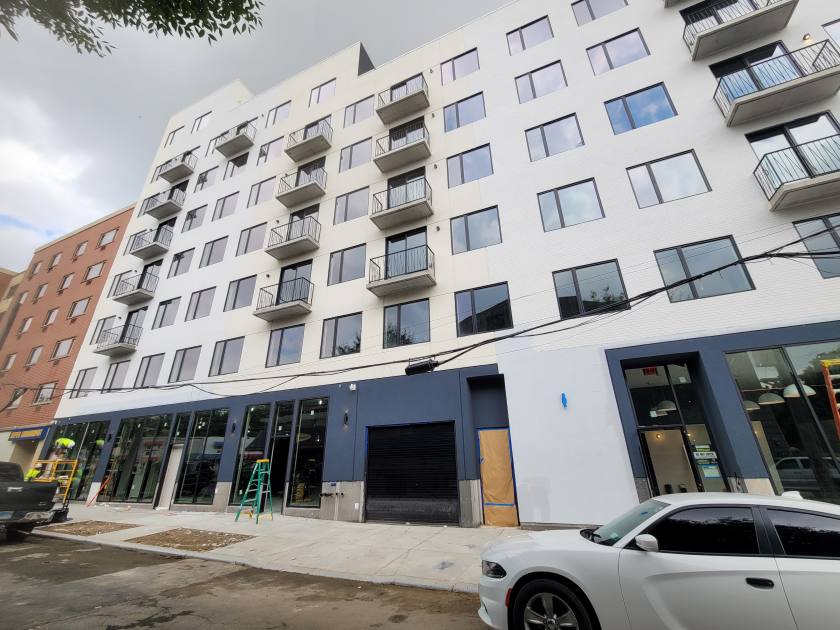
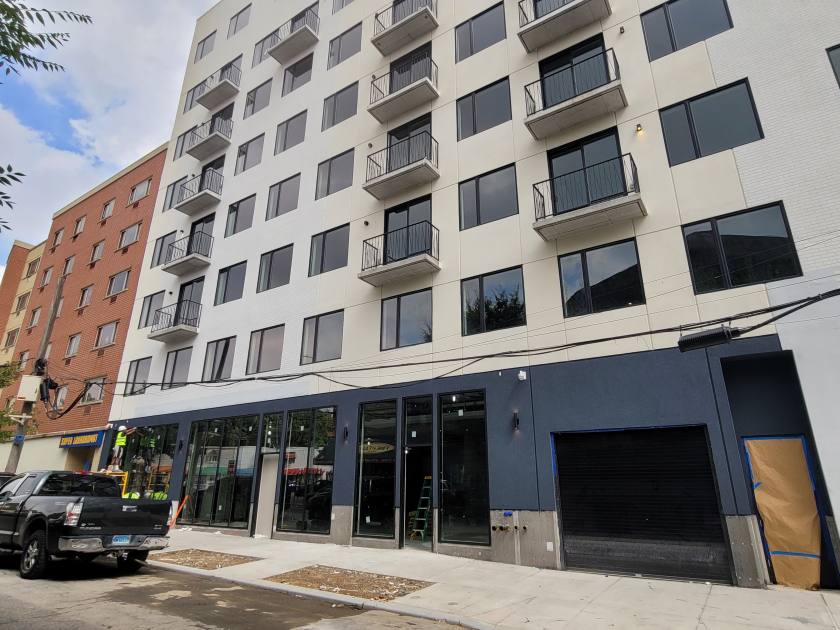
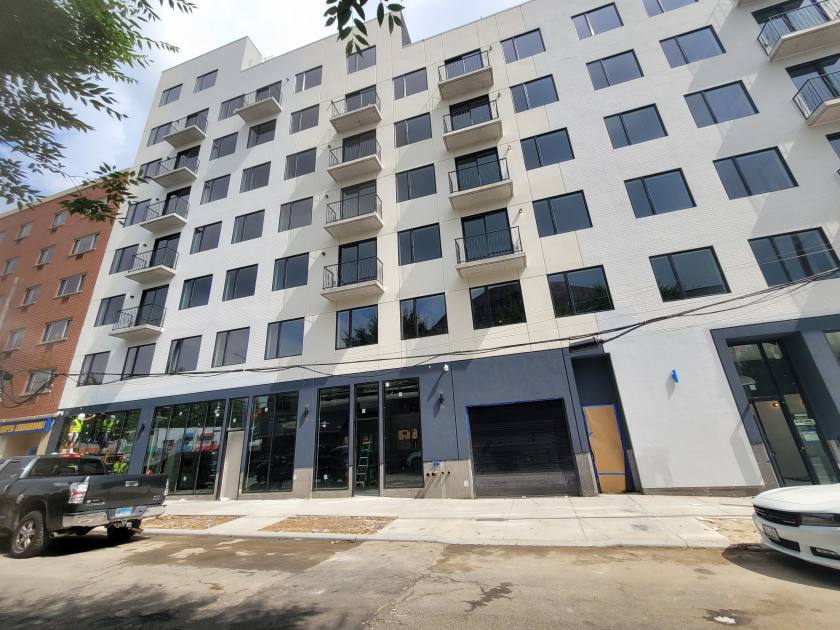
Retail Space
1420 Stebbins Avenue The Bronx, NY 10459
1420 Stebbins Avenue The Bronx, NY 10459
Details & Description
Property Highlights
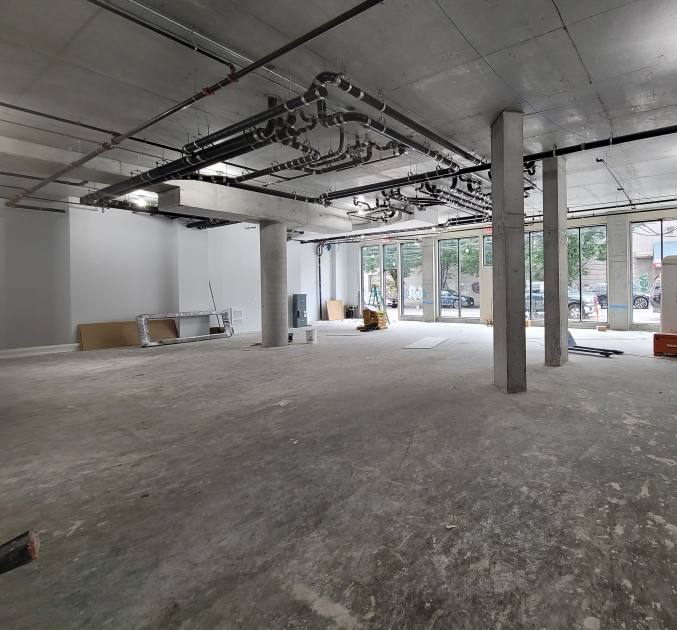
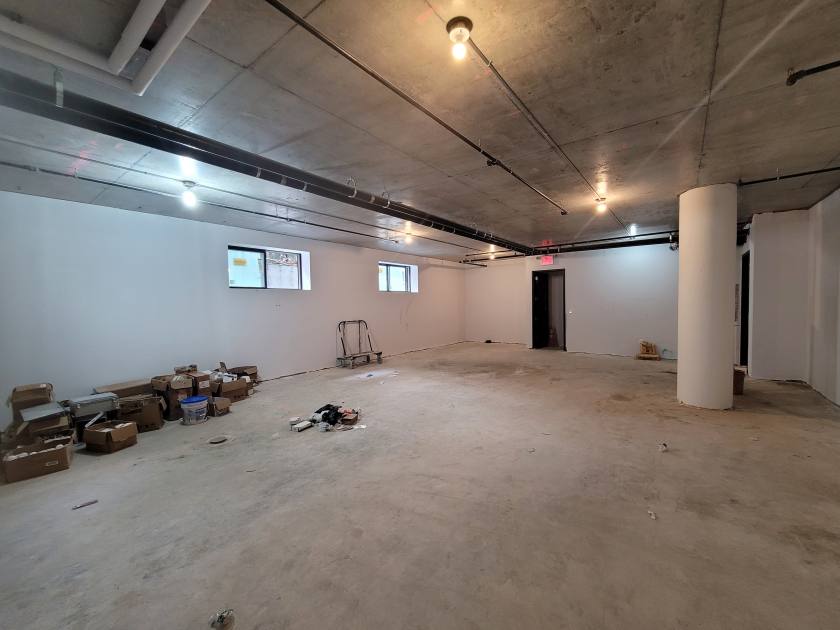
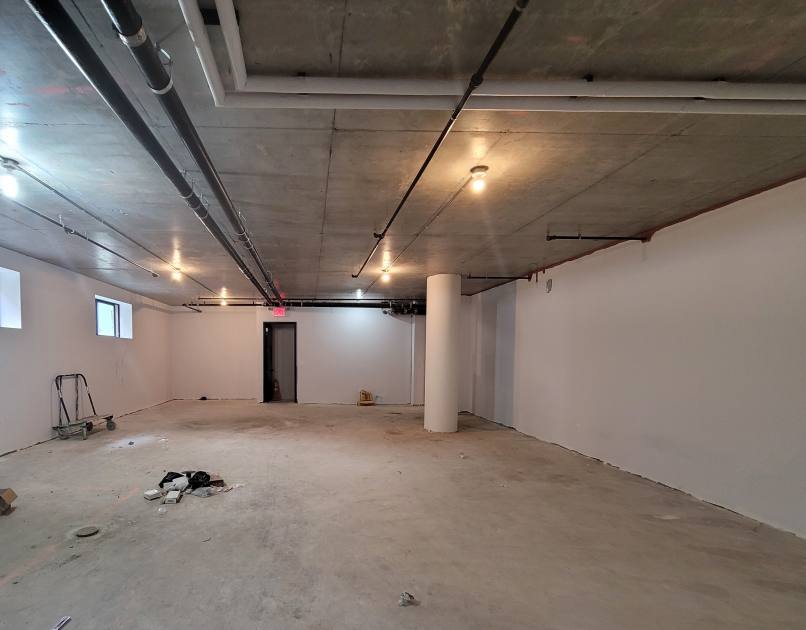
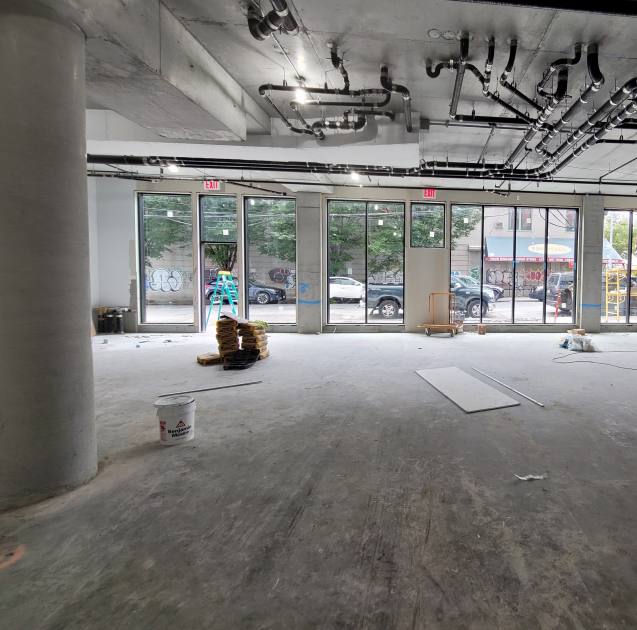
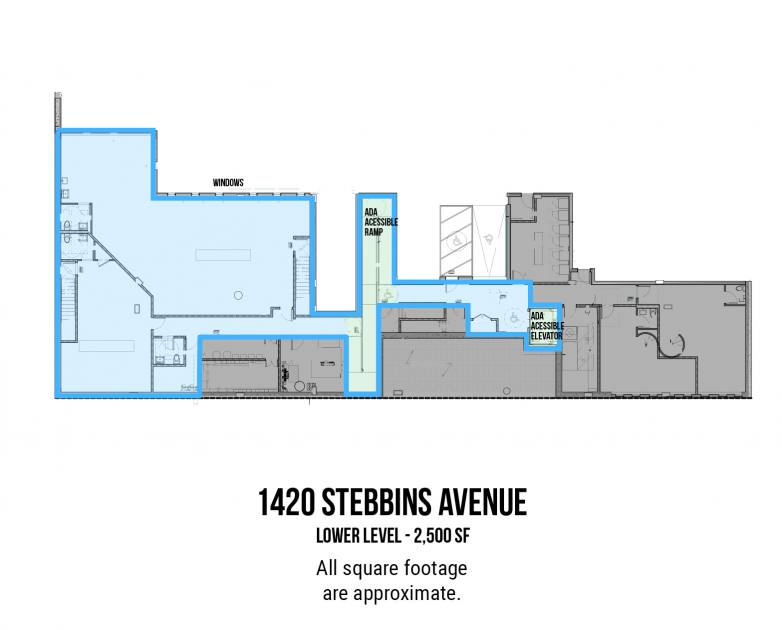
- • Lower level - 2,500 SF
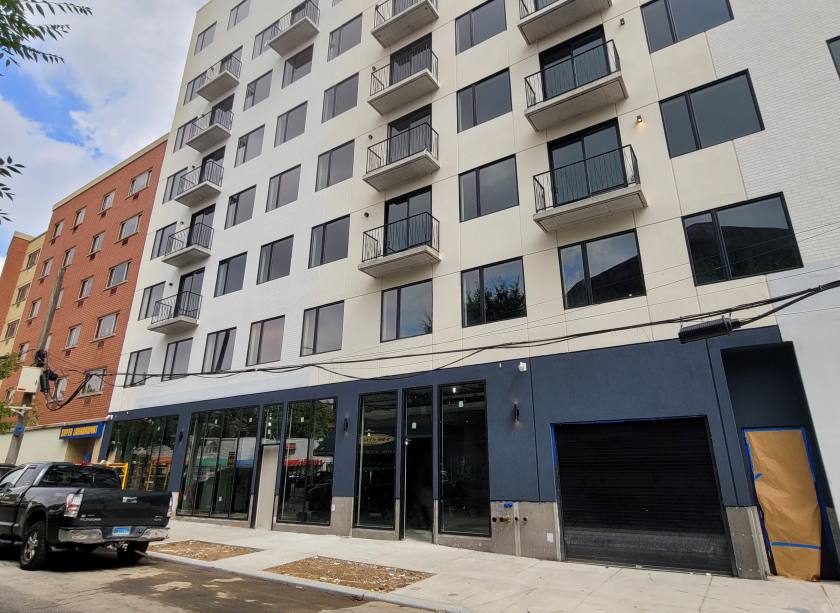
- • Brand new development
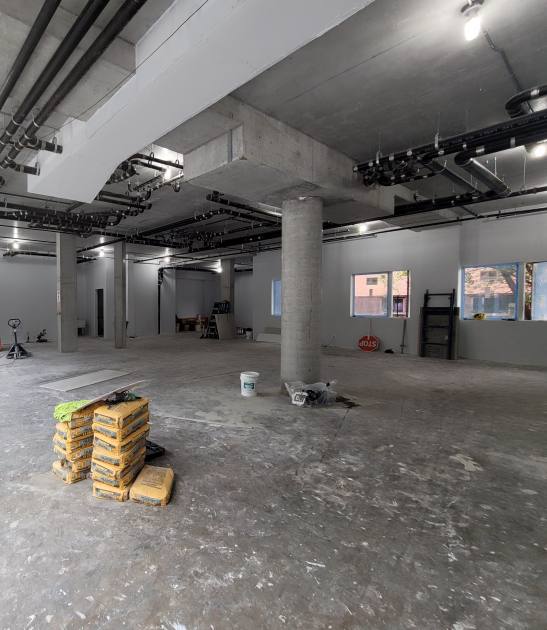
- • High ceilings
- • All glass storefronts
- • Tons of natural light
- • Divisible
Additional Photos
Listing Agents

Shlomi Bagdadi
O: 718-437-6100
info@tristatecr.com
O: 718-437-6100
info@tristatecr.com
While we strive to provide the most accurate information, all listing information, and demographic data, is provided by third-parties. As such, MyEListing will not be responsible for the accuracy of the information. It is strongly recommended that you verify all information with the listing agent, and any relevant agencies, prior to making any decisions.