Commercial Land
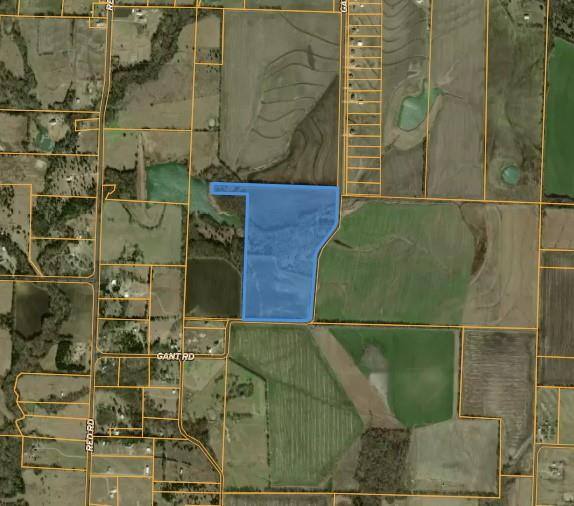
TBD Gant Road Sherman, TX 75090
TBD Gant Road Sherman, TX 75090

Details & Description
Property Highlights
- • Long Road Frontage
- • Easily Subdividable
- • Not in City Limits/ETJ
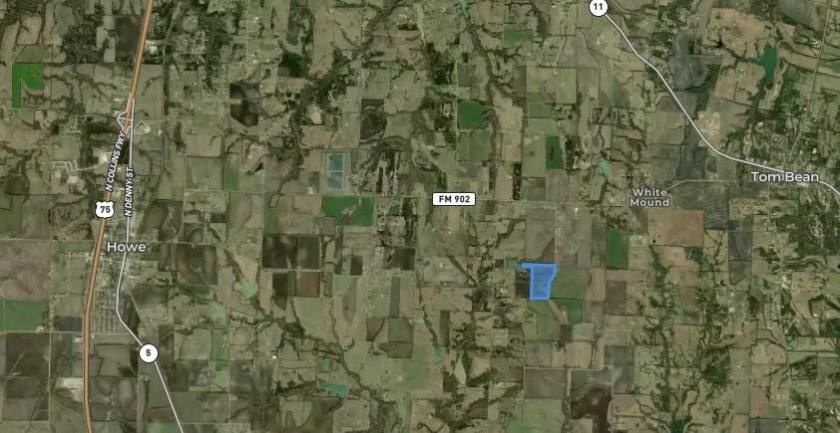
- • Active Investment Area
- • Near new TI/Globitech Plants in Sherman
- • Ag Exempt
Listing Agents

Mike Browning
M: 214-354-3583
mike@browningre.com
M: 214-354-3583
mike@browningre.com
While we strive to provide the most accurate information, all listing information, and demographic data, is provided by third-parties. As such, MyEListing will not be responsible for the accuracy of the information. It is strongly recommended that you verify all information with the listing agent, and any relevant agencies, prior to making any decisions.