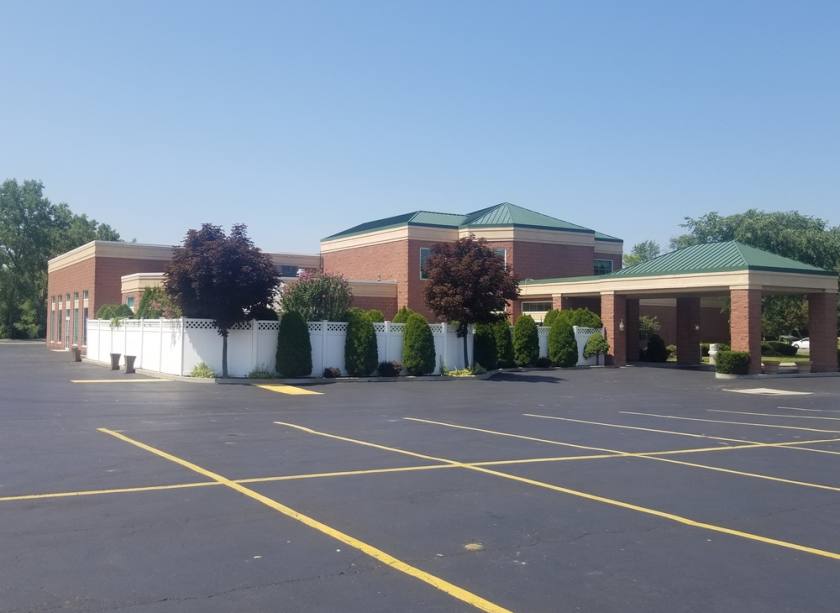
1-Mile | 3-Miles | 5-Miles | ||
---|---|---|---|---|
Total Population | 6,579 | 39,774 | 79,573 | |
Population Median Age | 44 | 43 | 42 | |
Population by Age | 0-9 Yrs | 551 (8%) | 3452 (8%) | 8305 (10%) |
10-19 Yrs | 686 (10%) | 4688 (11%) | 9443 (11%) | |
20-29 Yrs | 834 (12%) | 4520 (11%) | 9143 (11%) | |
30-39 Yrs | 833 (12%) | 4977 (12%) | 10015 (12%) | |
40-49 Yrs | 735 (11%) | 4756 (11%) | 9087 (11%) | |
50-59 Yrs | 868 (13%) | 5669 (14%) | 11954 (15%) | |
60-69 Yrs | 922 (14%) | 5534 (13%) | 10230 (12%) | |
70+ Yrs | 1151 (17%) | 6178 (15%) | 11398 (14%) | |
Median HH Income | $57,918 | $66,925 | $64,568 | |
Total Household Income | < 24K | 647 (21%) | 2887 (16%) | 6287 (18%) |
25-49K | 576 (19%) | 3802 (21%) | 7507 (21%) | |
50-74K | 615 (20%) | 3244 (18%) | 5777 (16%) | |
75-99K | 469 (15%) | 2561 (14%) | 4899 (14%) | |
100-199K | 621 (20%) | 4607 (25%) | 8494 (24%) | |
200K+ | 45 (1%) | 745 (4%) | 1629 (4%) | |
Highest Education Level | No Diploma | 258 | 1162 | 3642 |
Diploma or GED | 1703 | 8105 | 16839 | |
Some College | 927 | 5807 | 10400 | |
Assoc. Degree | 847 | 4734 | 8250 | |
Bachelors Degree | 697 | 5748 | 11119 | |
Higher Degree | 429 | 3802 | 7308 | |
Total Housing Units | 3,172 | 18,683 | 36,422 | |
--Owner-Occupied | 1,832 | 12,605 | 23,954 | |
--Renter-Occupied | 1,141 | 5,240 | 10,640 | |
Owner-Occupied Values | < 100K | 473 | 1668 | 4119 |
100-199K | 828 | 6536 | 11494 | |
200-299K | 440 | 3237 | 5544 | |
300-399K | 81 | 884 | 1910 | |
400-499K | 1 | 143 | 477 | |
500K+ | 10 | 136 | 409 | |
Total Working Age Population | 5,524 | 33,264 | 65,173 | |
In Work Force | 3,251 | 21,480 | 41,827 | |
Not In Work Force | 2,273 | 11,783 | 23,345 | |
Workforce Employed | 3,204 | 20,878 | 40,147 | |
Workforce Unemployed | 24 | 549 | 1,623 | |
Civlian Workforce | 3,228 | 21,427 | 41,770 | |
Military Workforce | 23 | 53 | 57 | |
Total Households | 2,973 | 17,845 | 34,594 | |
Family Households | 1,812 | 10,595 | 20,694 | |
Non-Family Households | 1,162 | 7,250 | 13,900 | |
Married Couple | 1,289 | 8,050 | 15,106 | |
Other Family | 523 | 2,545 | 5,588 | |
Married w/Child | 413 | 2,830 | 5,399 | |
Single Male w/Child | 130 | 435 | 840 | |
Single Female w/Child | 161 | 889 | 2,004 |
Population Change Last Two Decades - Plus Projection
2000 | % | 2010 | % | 2020 | % | 2030 | |
---|---|---|---|---|---|---|---|
New York | 18,976,457 | +2 | 19,378,102 | +4 | 20,146,131 | +2 | 20,604,030 |
Erie County | 950,265 | -3 | 919,040 | +2 | 936,084 | +1 | 949,073 |
Total Working Age Population:
Total Households:
Total Working Age Population:
Total Households:
Total Working Age Population:
Total Households: