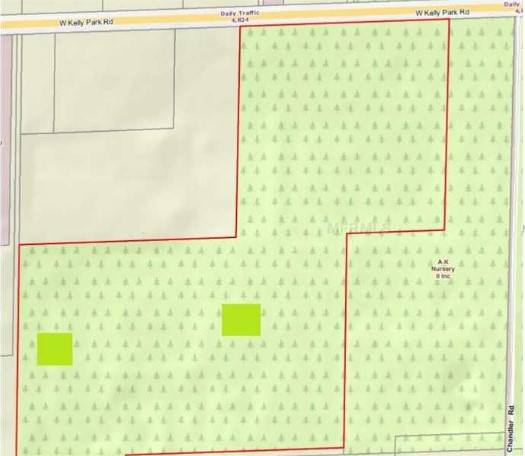
1-Mile | 3-Miles | 5-Miles | ||
---|---|---|---|---|
Total Population | 1,313 | 18,070 | 50,377 | |
Population Median Age | 40 | 42 | 40 | |
Population by Age | 0-9 Yrs | 118 (8%) | 1902 (10%) | 6269 (12%) |
10-19 Yrs | 235 (17%) | 2404 (13%) | 6161 (12%) | |
20-29 Yrs | 102 (7%) | 1511 (8%) | 5471 (10%) | |
30-39 Yrs | 133 (10%) | 2170 (12%) | 6155 (12%) | |
40-49 Yrs | 254 (19%) | 2875 (15%) | 7523 (14%) | |
50-59 Yrs | 182 (13%) | 2399 (13%) | 6751 (13%) | |
60-69 Yrs | 155 (11%) | 2369 (13%) | 5746 (11%) | |
70+ Yrs | 134 (10%) | 2438 (13%) | 6300 (12%) | |
Median HH Income | $82,113 | $80,492 | $73,196 | |
Total Household Income | < 24K | 69 (15%) | 679 (11%) | 1644 (9%) |
25-49K | 51 (11%) | 977 (16%) | 3870 (23%) | |
50-74K | 92 (20%) | 1165 (19%) | 3098 (18%) | |
75-99K | 30 (6%) | 794 (13%) | 2451 (14%) | |
100-199K | 128 (28%) | 1704 (28%) | 4569 (27%) | |
200K+ | 71 (16%) | 672 (11%) | 1171 (6%) | |
Highest Education Level | No Diploma | 93 | 1421 | 4069 |
Diploma or GED | 290 | 3887 | 9704 | |
Some College | 186 | 2724 | 7390 | |
Assoc. Degree | 82 | 1386 | 4220 | |
Bachelors Degree | 160 | 2504 | 6871 | |
Higher Degree | 93 | 1071 | 2894 | |
Total Housing Units | 486 | 6,676 | 18,479 | |
--Owner-Occupied | 362 | 5,064 | 13,605 | |
--Renter-Occupied | 79 | 926 | 3,198 | |
Owner-Occupied Values | < 100K | 27 | 786 | 1644 |
100-199K | 54 | 842 | 2626 | |
200-299K | 63 | 1316 | 4649 | |
300-399K | 110 | 1028 | 2693 | |
400-499K | 91 | 725 | 1039 | |
500K+ | 17 | 367 | 953 | |
Total Working Age Population | 1,016 | 14,455 | 39,866 | |
In Work Force | 649 | 8,679 | 25,318 | |
Not In Work Force | 367 | 5,776 | 14,548 | |
Workforce Employed | 644 | 8,451 | 24,268 | |
Workforce Unemployed | 5 | 228 | 1,050 | |
Civlian Workforce | 649 | 8,679 | 25,318 | |
Military Workforce | 0 | 0 | 0 | |
Total Households | 442 | 5,991 | 16,803 | |
Family Households | 340 | 4,740 | 12,839 | |
Non-Family Households | 102 | 1,251 | 3,963 | |
Married Couple | 274 | 3,835 | 10,069 | |
Other Family | 66 | 905 | 2,770 | |
Married w/Child | 118 | 1,378 | 3,744 | |
Single Male w/Child | 8 | 196 | 448 | |
Single Female w/Child | 30 | 226 | 768 |
Population Change Last Two Decades - Plus Projection
2000 | % | 2010 | % | 2020 | % | 2030 | |
---|---|---|---|---|---|---|---|
Florida | 15,982,378 | +18 | 18,801,310 | +14 | 21,517,610 | +13 | 24,340,457 |
Lake County | 210,528 | +41 | 297,052 | +21 | 360,739 | +21 | 437,201 |
Orange County | 896,344 | +28 | 1,145,956 | +24 | 1,415,511 | +20 | 1,693,977 |
Total Working Age Population:
Total Households:
Total Working Age Population:
Total Households:
Total Working Age Population:
Total Households: