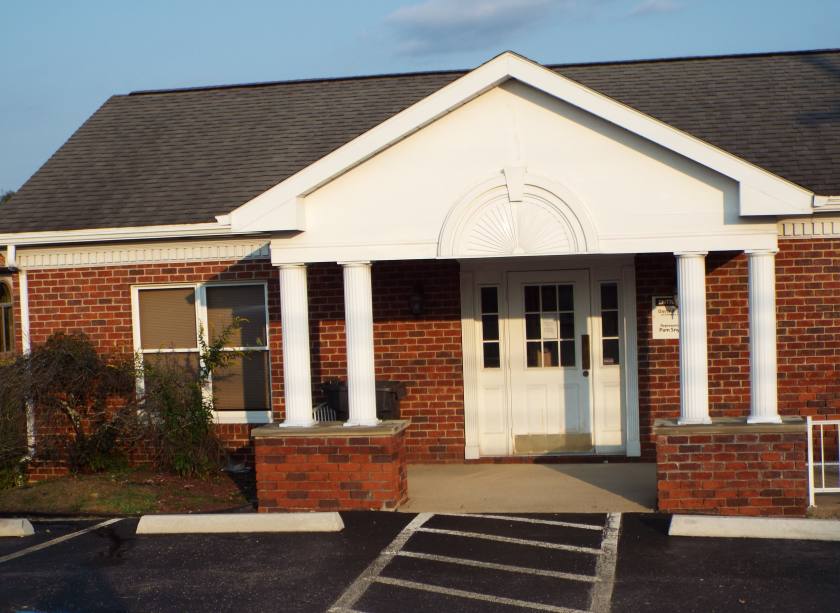
Office Space
113 Thornton Road Brownsville, PA 15417
113 Thornton Road Brownsville, PA 15417
Details & Description
Property Highlights
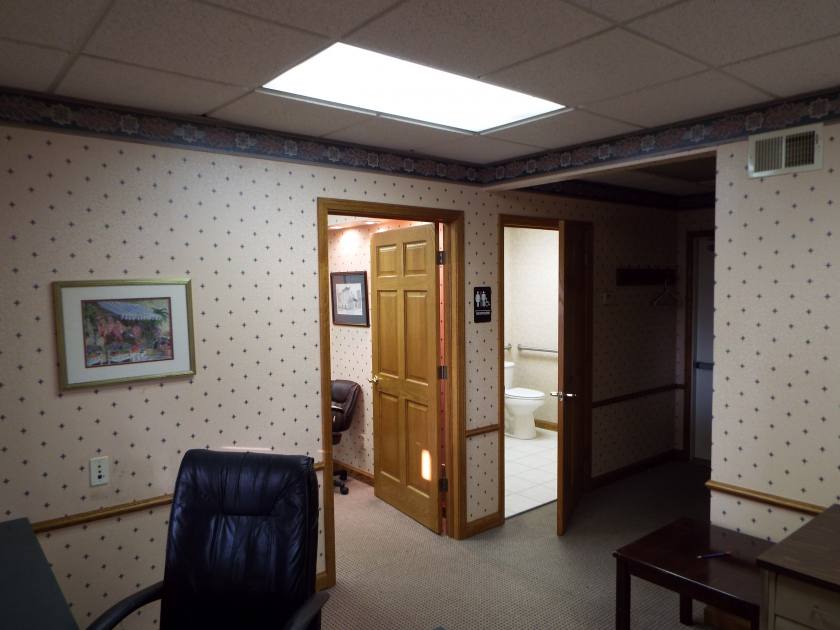
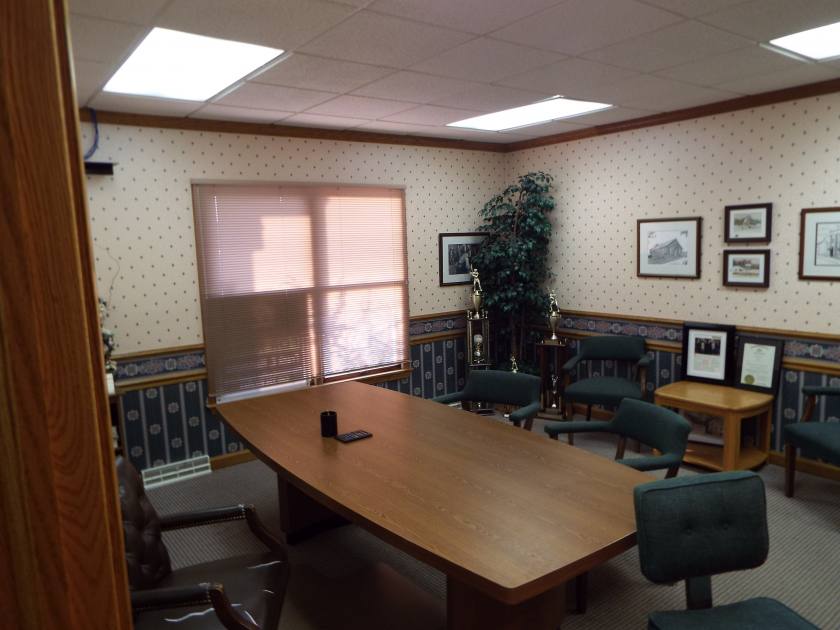
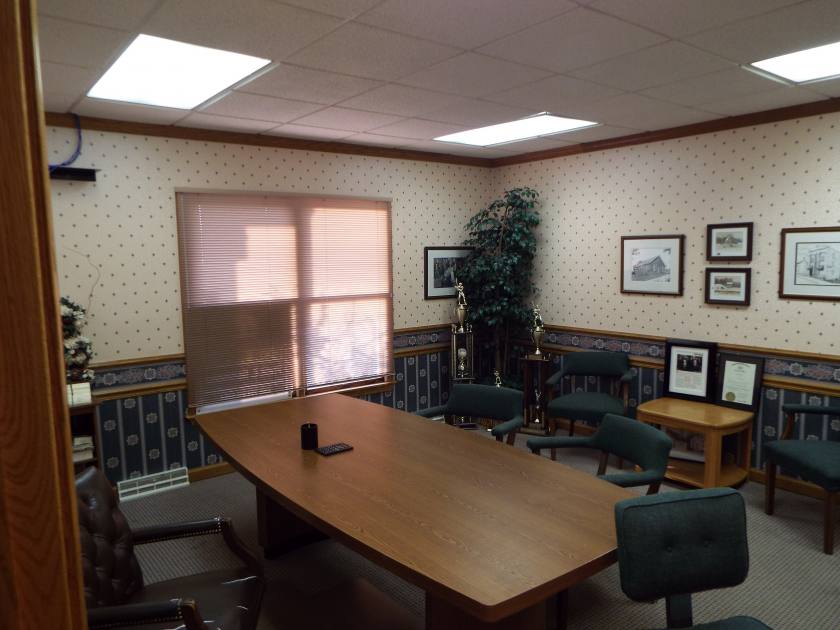
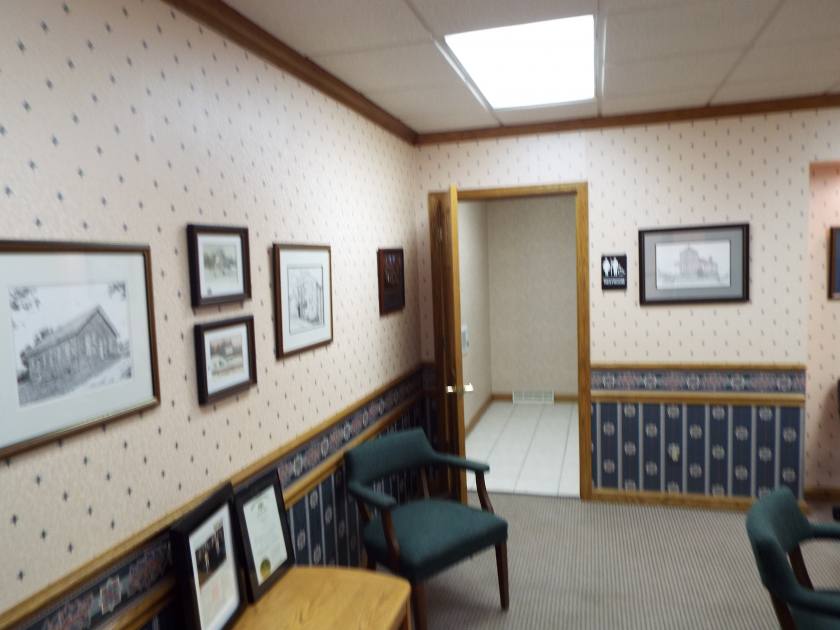
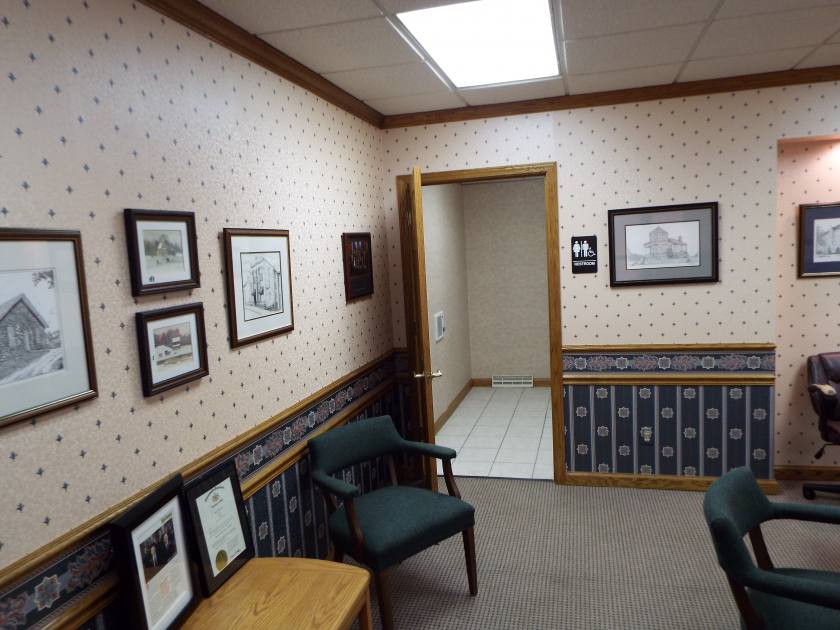
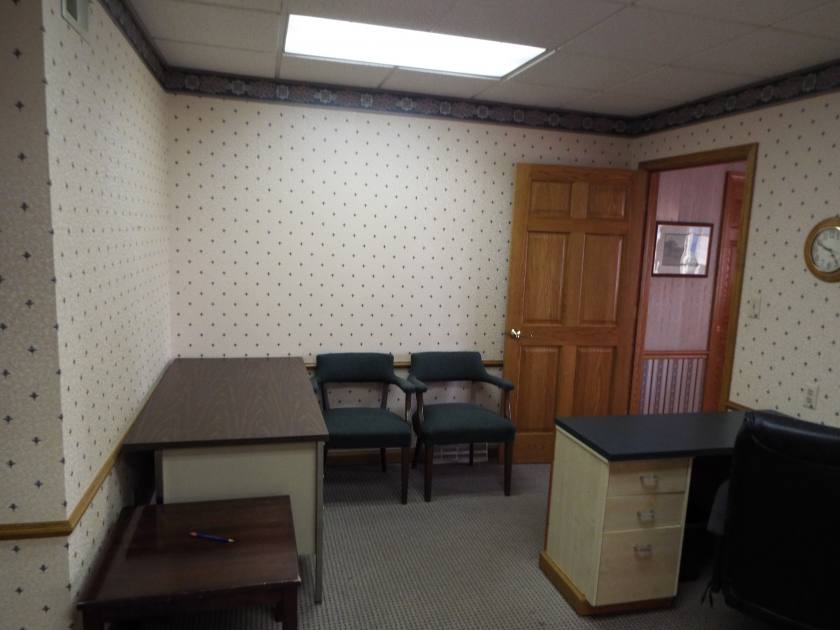
• Former attorney and state representative office space
• Former attorney and state representative office space
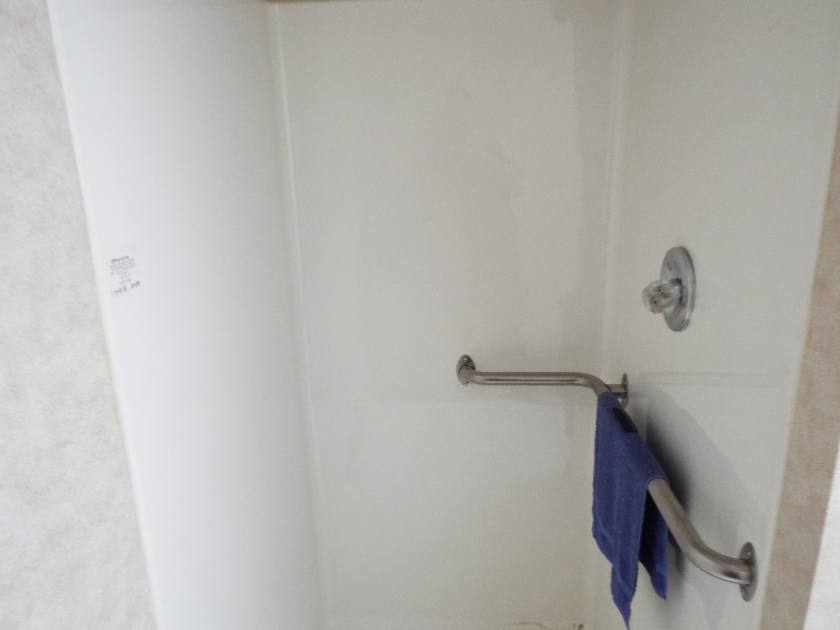
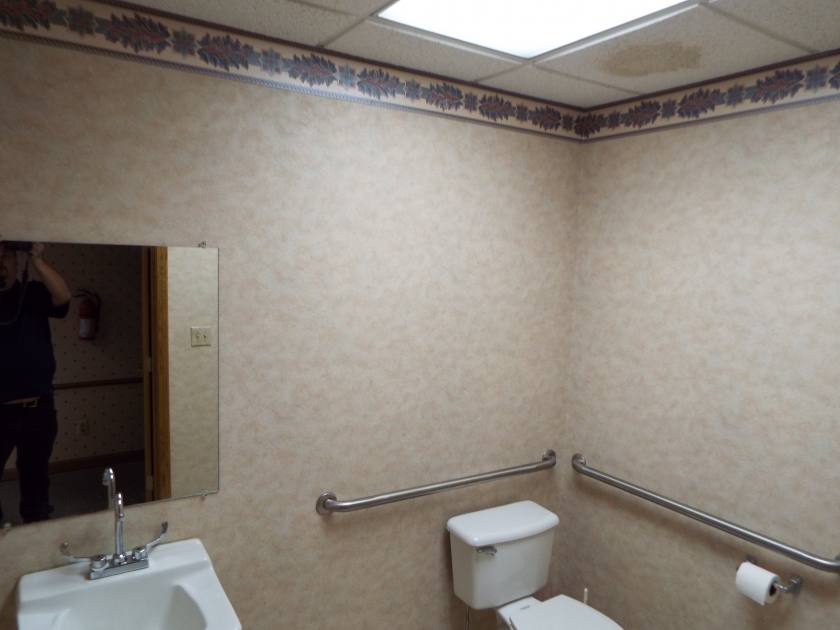
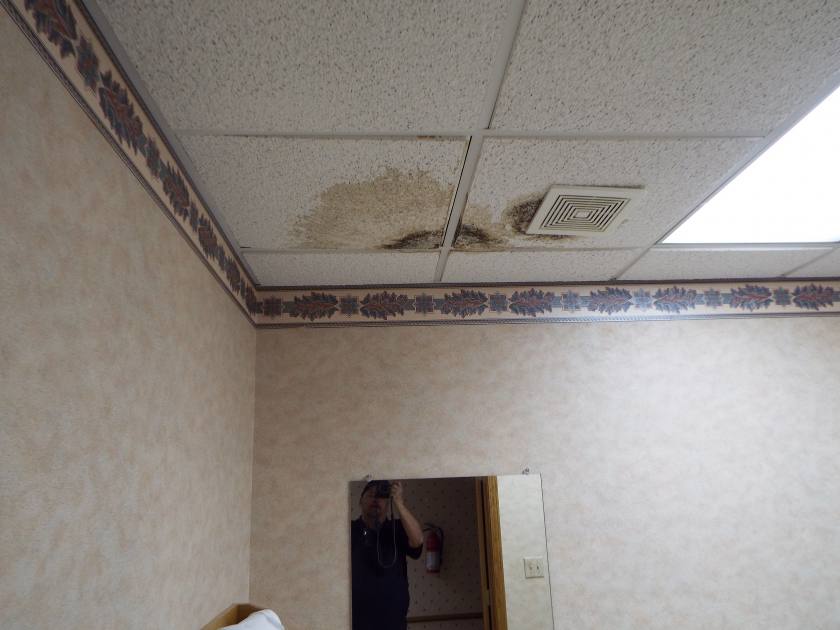
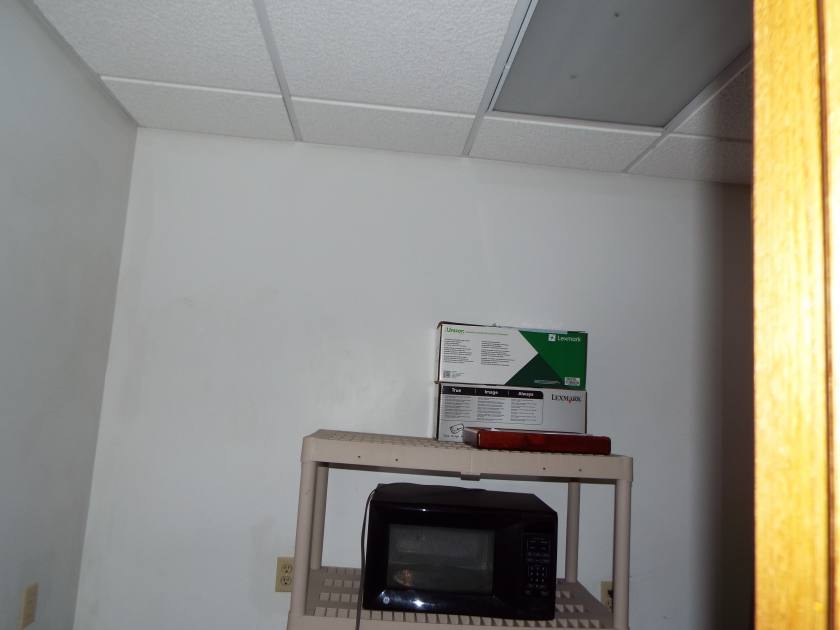
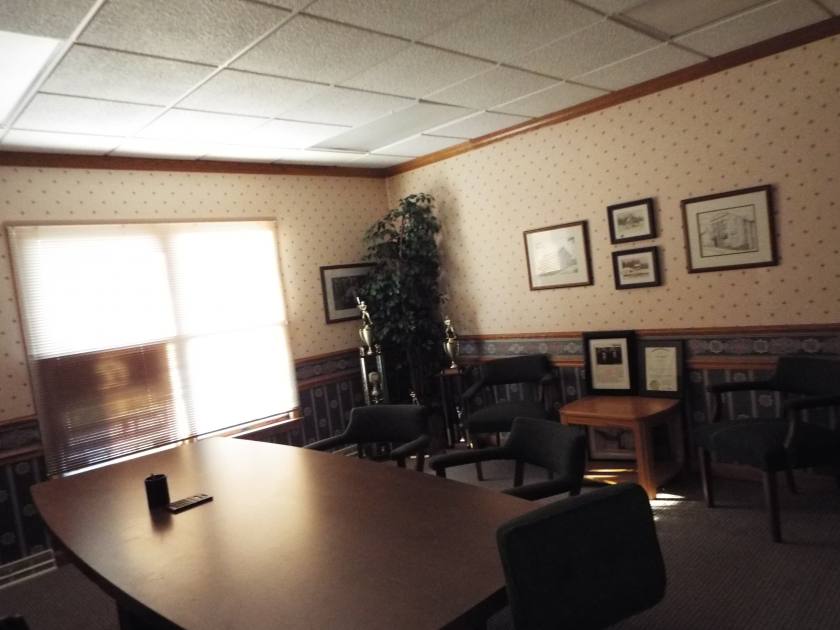
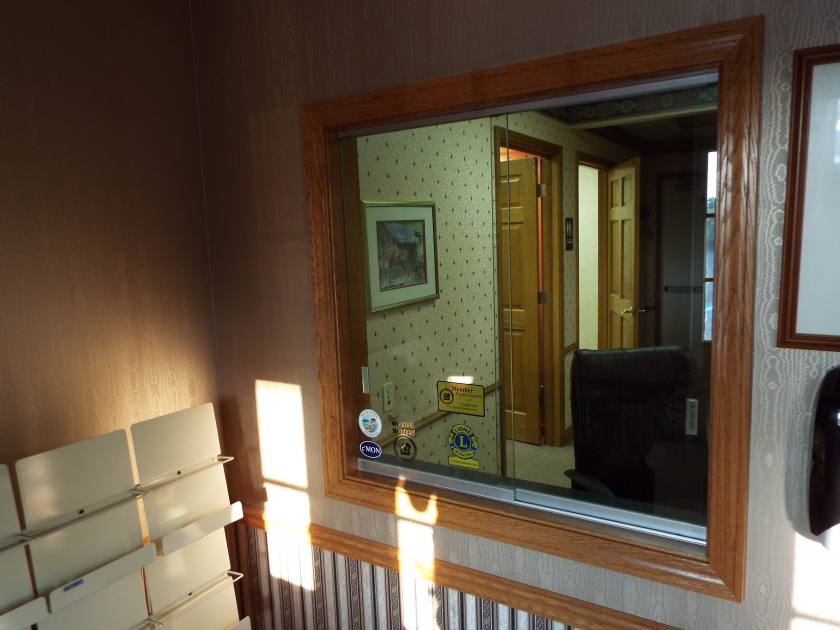
Additional Photos


Listing Agents

Frank Hammond
O: 864-527-5451
M: 864-270-0761
fhammondrealtor@gmail.com
O: 864-527-5451
M: 864-270-0761
fhammondrealtor@gmail.com
While we strive to provide the most accurate information, all listing information, and demographic data, is provided by third-parties. As such, MyEListing will not be responsible for the accuracy of the information. It is strongly recommended that you verify all information with the listing agent, and any relevant agencies, prior to making any decisions.