Retail Space
34 Riverview Avenue Paulsboro, NJ 08066
34 Riverview Avenue Paulsboro, NJ 08066
Details & Description
Property Highlights
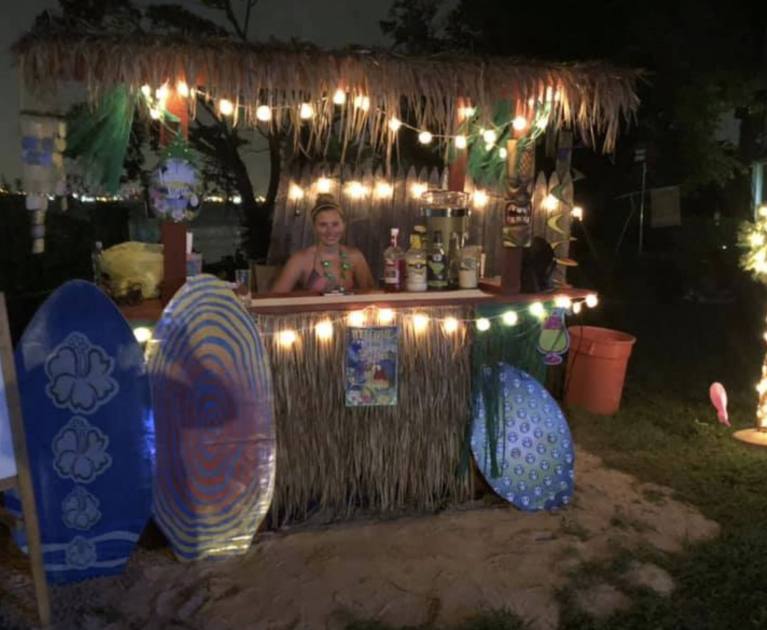
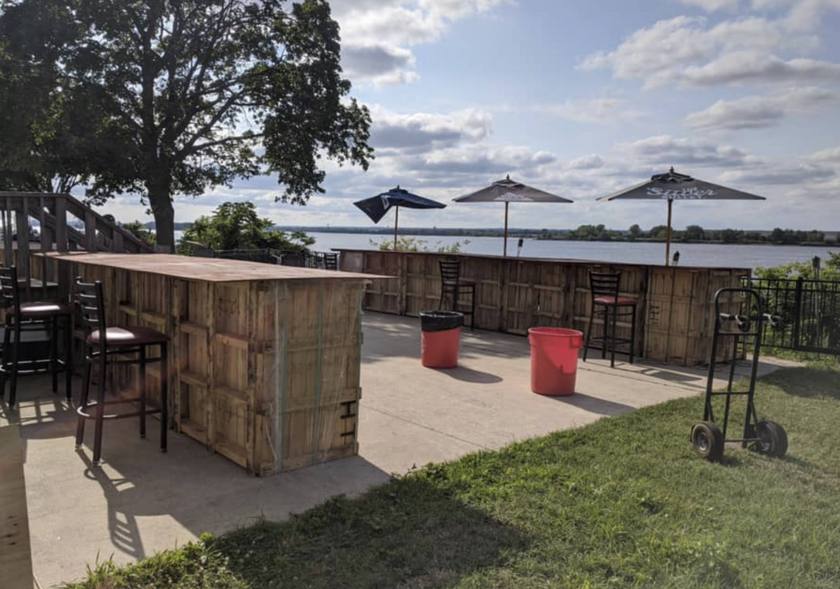
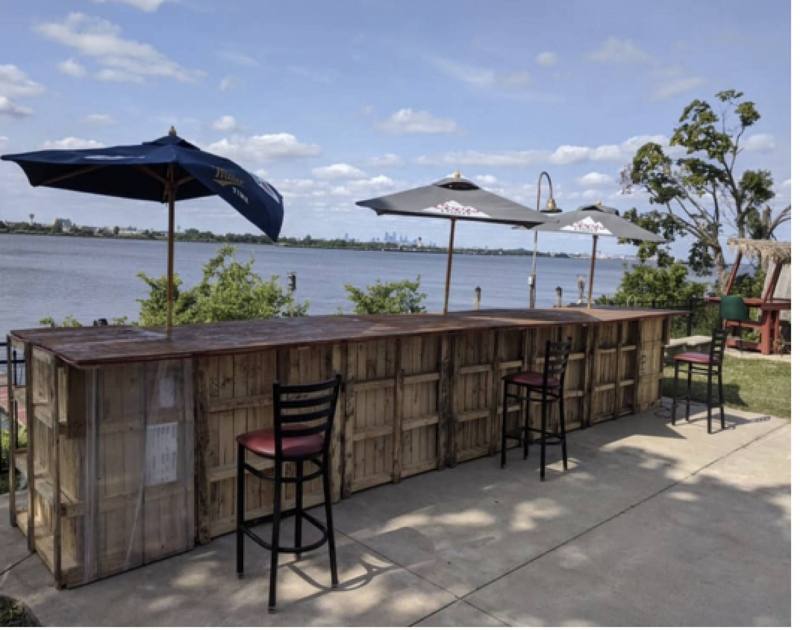
- • Restaurant in sports bar
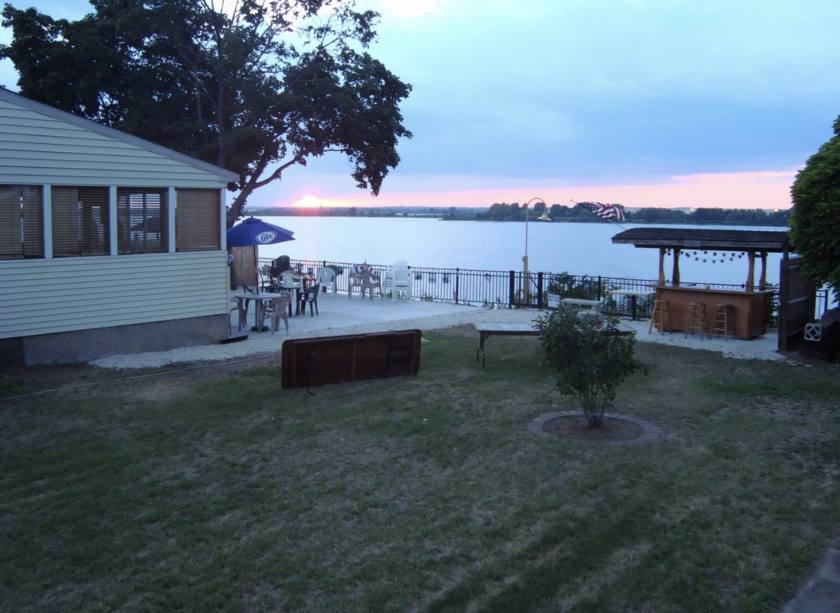
- • Private events
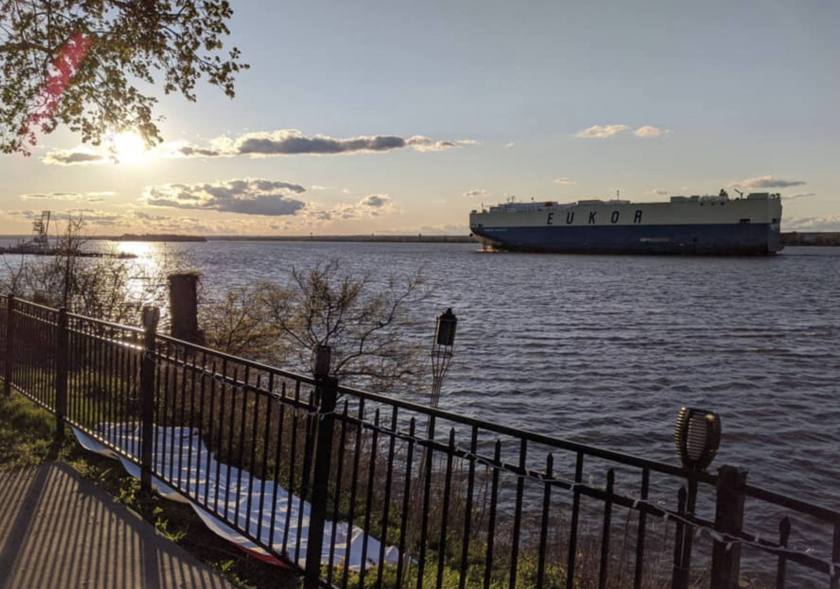
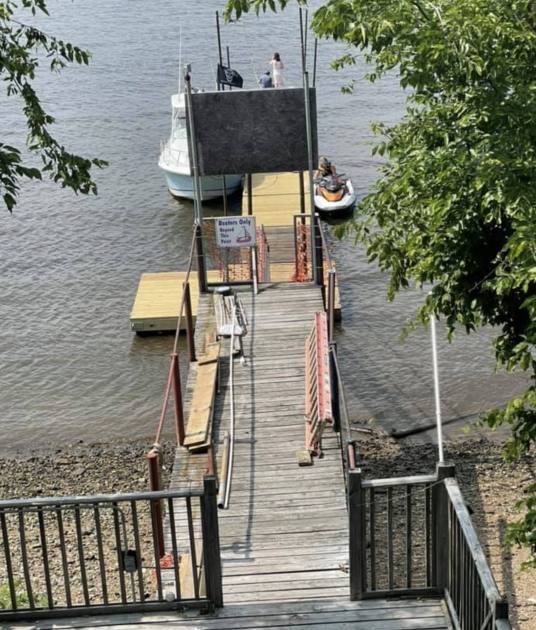
- • Waterfront views
- • Full kitchen
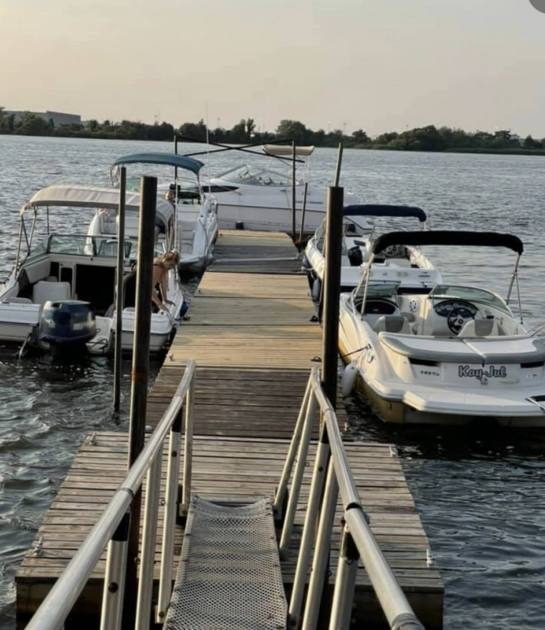
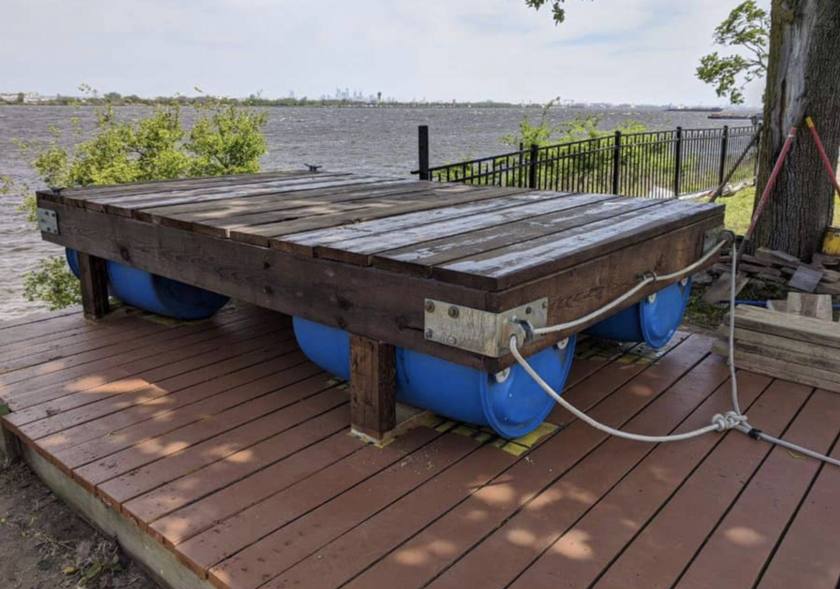
- • Boating dock
Additional Photos


Listing Agents

Andre Watson
O: 267-221-4946
M: 610-637-4422
andrewatson@kwcommercial.com
O: 267-221-4946
M: 610-637-4422
andrewatson@kwcommercial.com
While we strive to provide the most accurate information, all listing information, and demographic data, is provided by third-parties. As such, MyEListing will not be responsible for the accuracy of the information. It is strongly recommended that you verify all information with the listing agent, and any relevant agencies, prior to making any decisions.