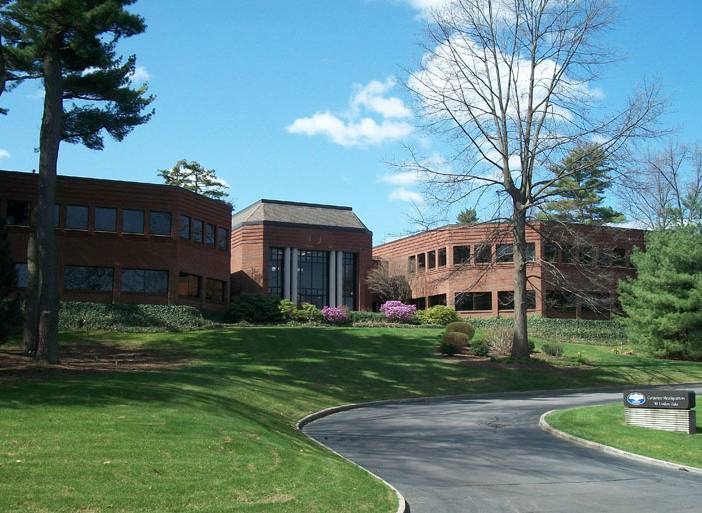
Office Space
90 Linden Oaks Rochester, NY 14625
90 Linden Oaks Rochester, NY 14625
Details & Description
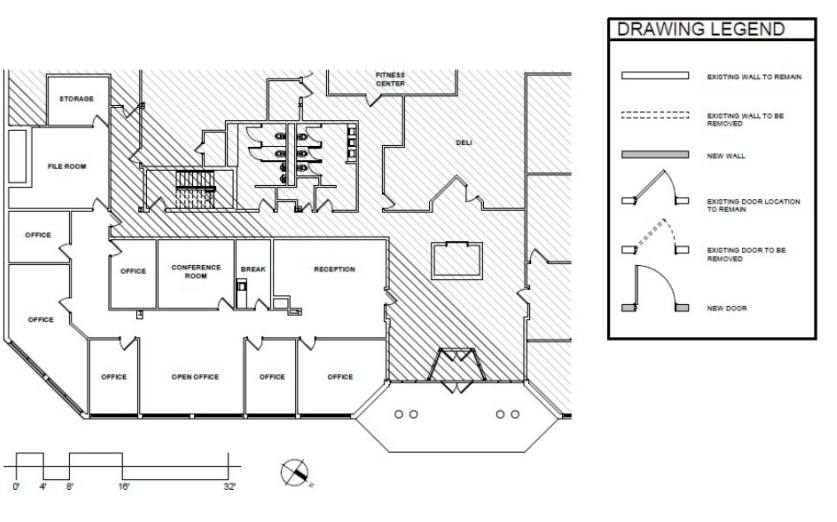
Property Highlights
- • Close proximity to I-490
- • Full turnkey build-out available
- • Underground parking
- • Newly renovated common area
- • Building offers onsite gym
Additional Photos


Listing Agents

John Ticco III
O: 716-852-7500
M: 716-863-5304
jticco@pyramidbrokerage.com
O: 716-852-7500
M: 716-863-5304
jticco@pyramidbrokerage.com
While we strive to provide the most accurate information, all listing information, and demographic data, is provided by third-parties. As such, MyEListing will not be responsible for the accuracy of the information. It is strongly recommended that you verify all information with the listing agent, and any relevant agencies, prior to making any decisions.