Industrial Properties
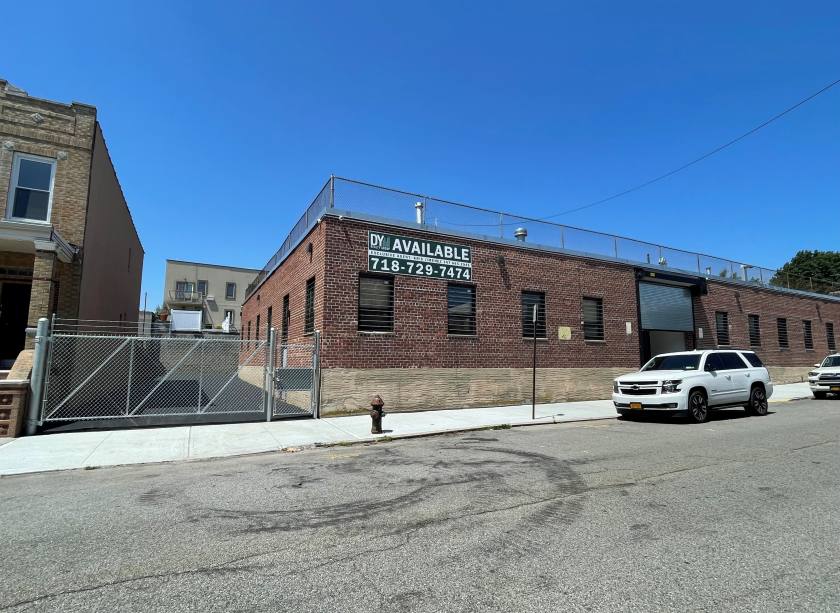
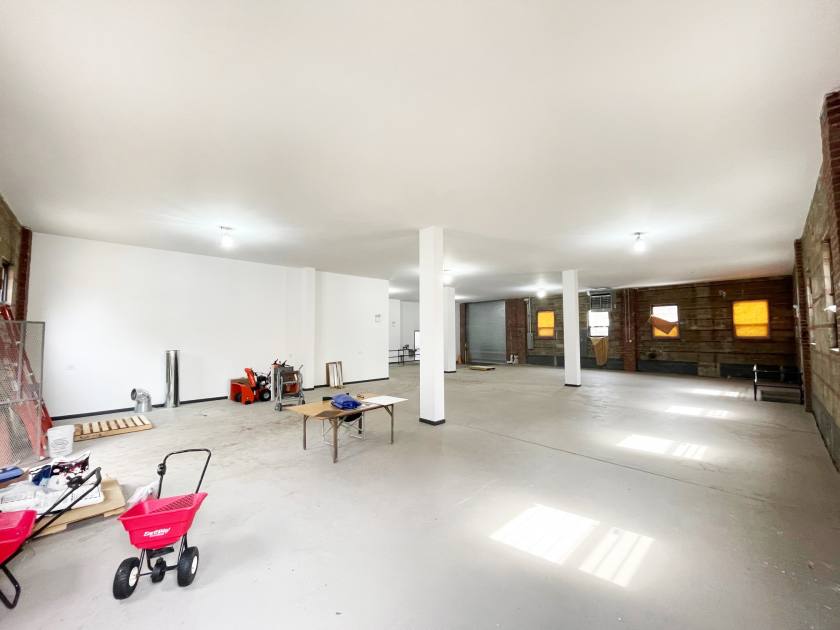
69-20 76th Street Queens, NY 11379
69-20 76th Street Queens, NY 11379
Details & Description
Property Highlights
- • 4,000 sf Industrial warehouse
- • 1,300 sf of land
- • 2021 complete renovation
- • 14' ceiling
- • 1 drive in gate
- • Established, clean businesses only
Additional Photos


Listing Agents

Kris Jimenez
O: 718-729-7474
M: 347-865-2945
kjimenez@dyrealty.com
O: 718-729-7474
M: 347-865-2945
kjimenez@dyrealty.com
While we strive to provide the most accurate information, all listing information, and demographic data, is provided by third-parties. As such, MyEListing will not be responsible for the accuracy of the information. It is strongly recommended that you verify all information with the listing agent, and any relevant agencies, prior to making any decisions.


