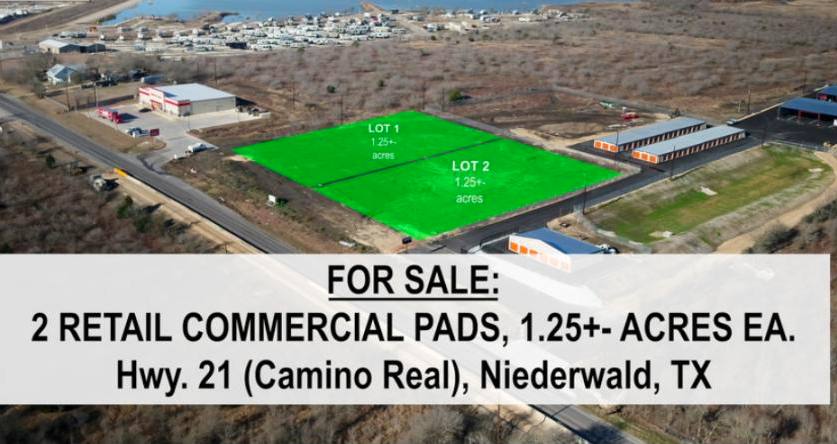
Commercial Land
13153 Camino Real Niederwald, TX 78640
13153 Camino Real Niederwald, TX 78640
Details & Description
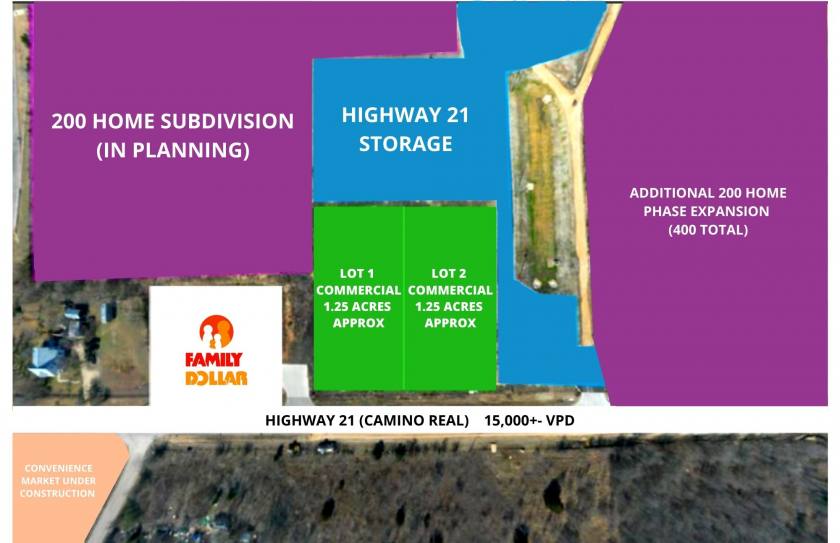
Property Highlights
• Master-planned site improvements including grading, drainage, off-sight detention, shared driveway & metered water
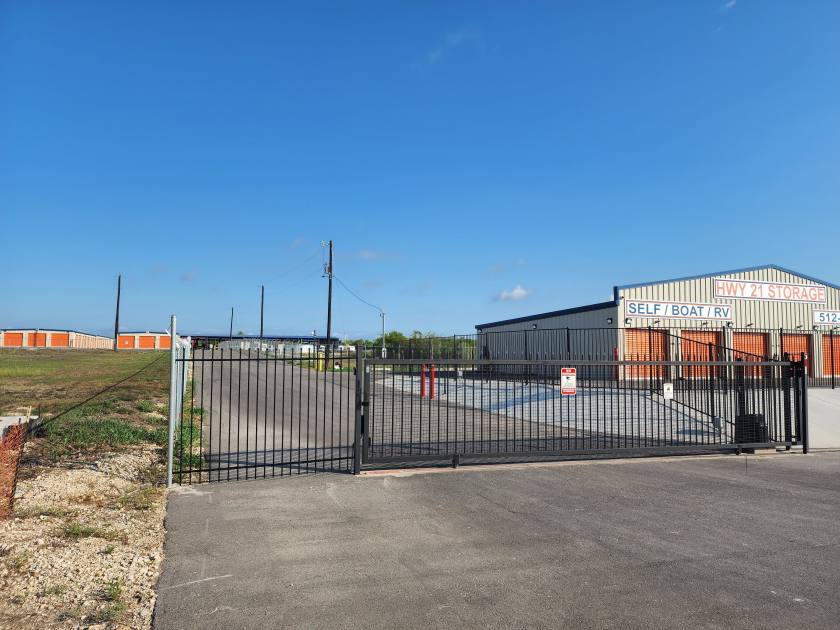
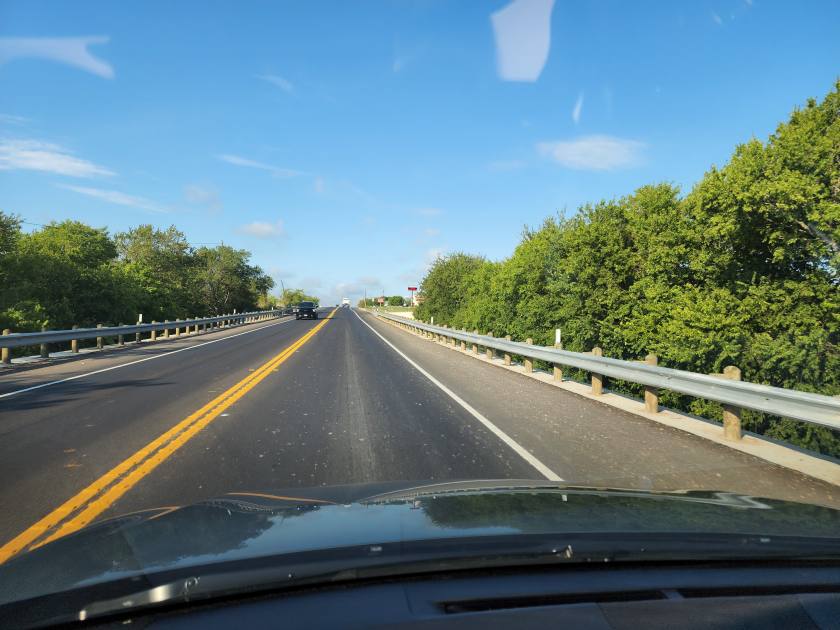
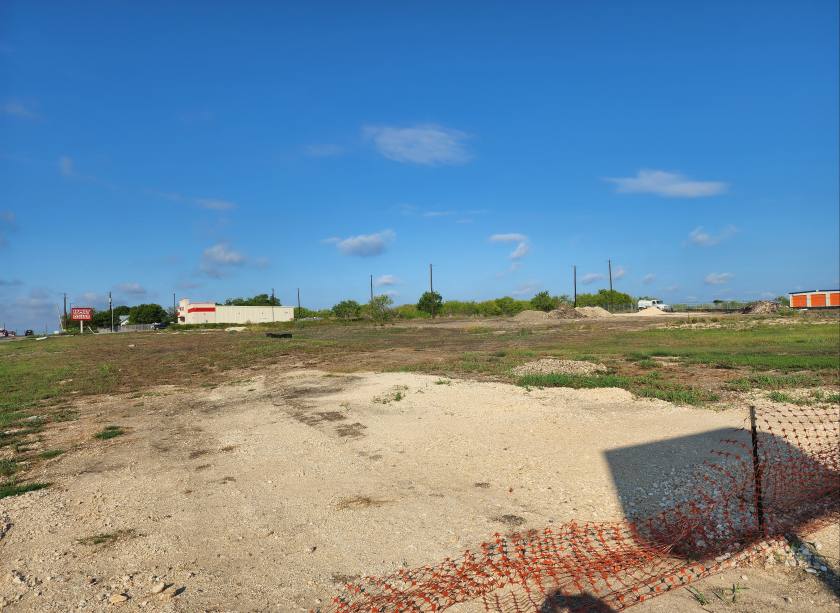
• Improved retail / commercial pads fronting busy Highway 21 (Camino Real) in rapidly growing area.
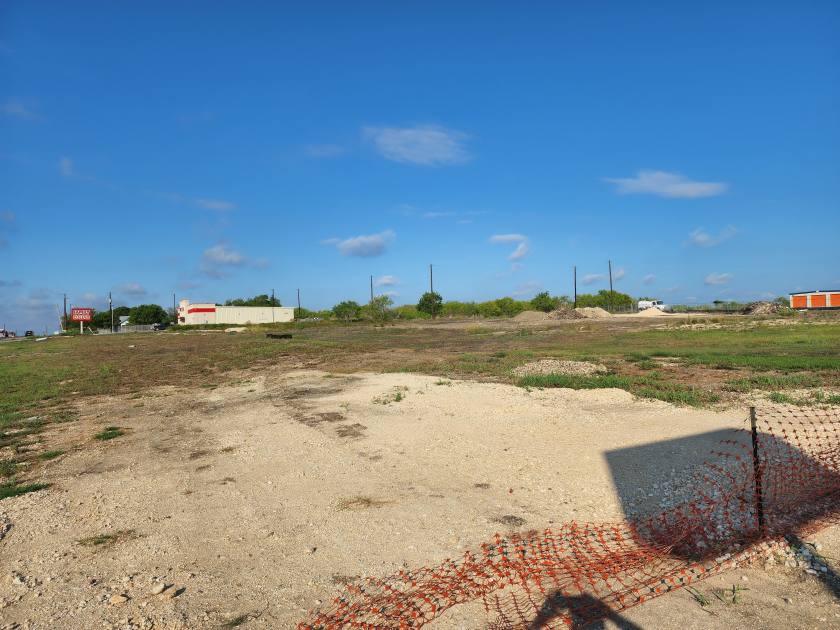
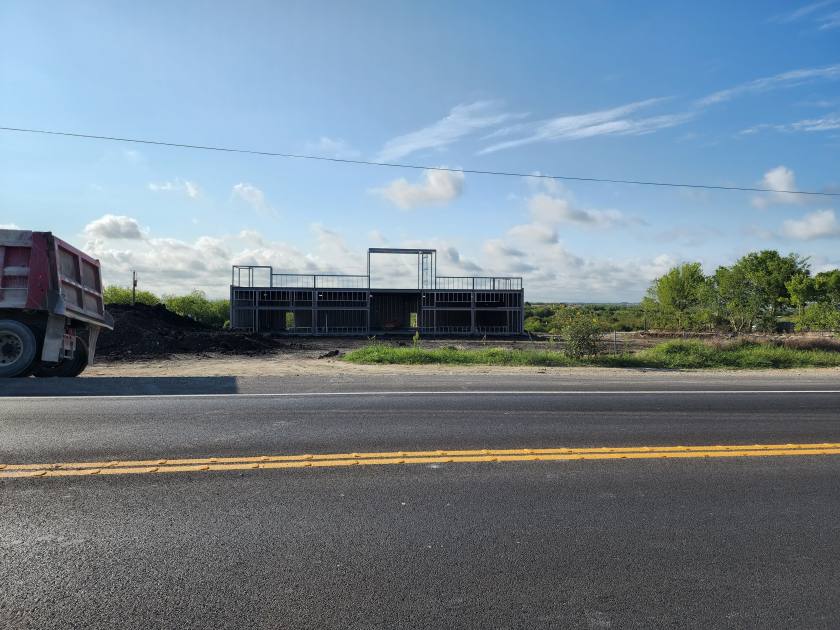
Additional Photos

Listing Agents

Richard Hall
O: 512-346-3550
M: 512-659-8587
rshall03@gmail.com
O: 512-346-3550
M: 512-659-8587
rshall03@gmail.com
While we strive to provide the most accurate information, all listing information, and demographic data, is provided by third-parties. As such, MyEListing will not be responsible for the accuracy of the information. It is strongly recommended that you verify all information with the listing agent, and any relevant agencies, prior to making any decisions.