Office Space
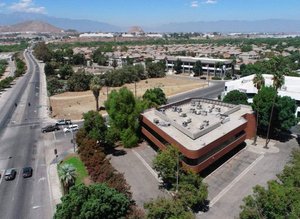
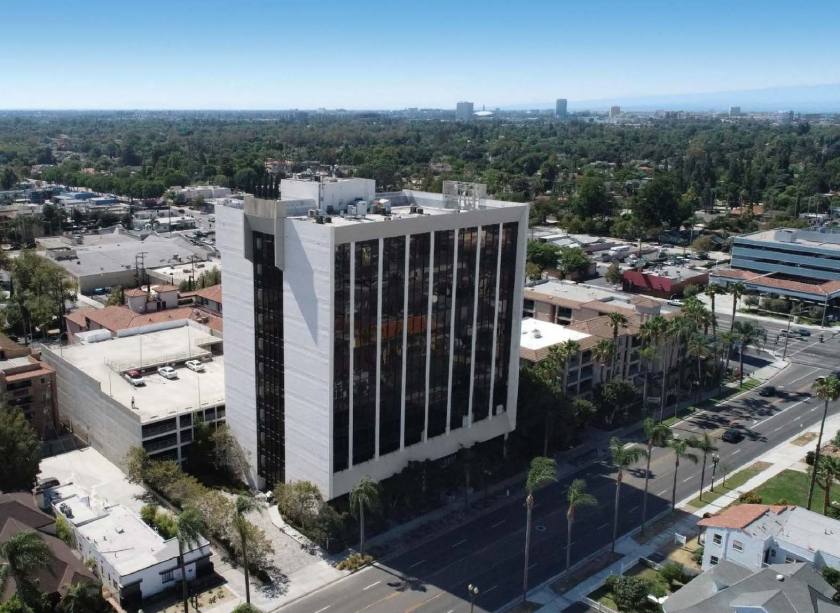
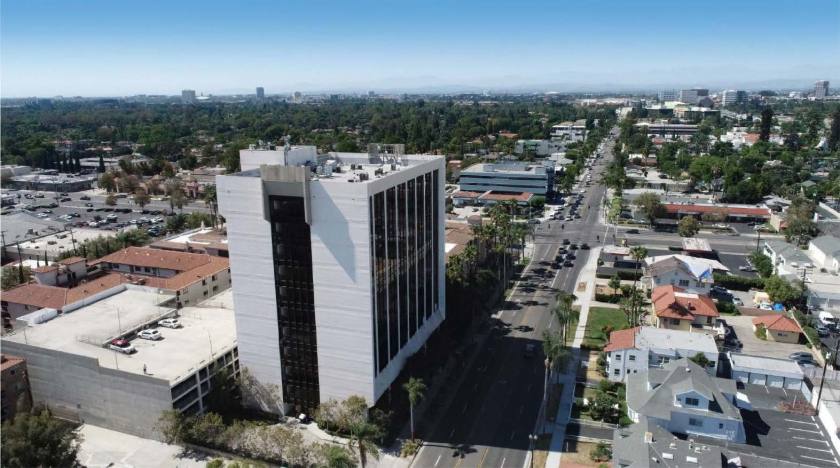
1600 North Broadway Santa Ana, CA 92706
1600 North Broadway Santa Ana, CA 92706
Details & Description
Property Highlights
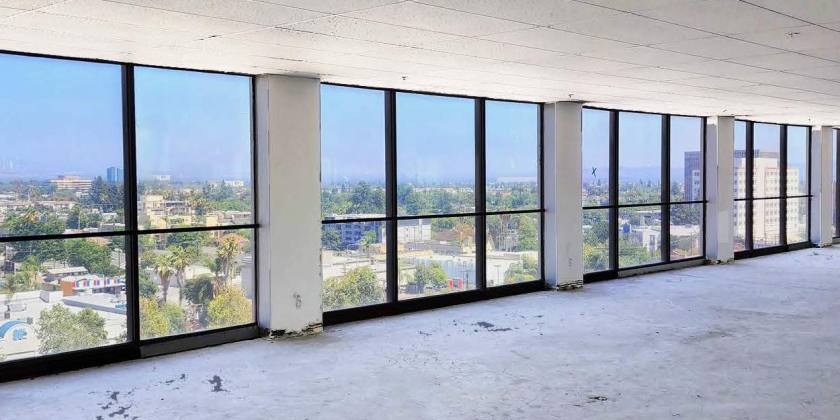
- • Floor to ceiling windows with panoramic views
- • Build-to-suit medical office suites
- • Competitive Lease Rates
- • Easy access from the 5 and 55 Freeways
- • Abundant free structured parking
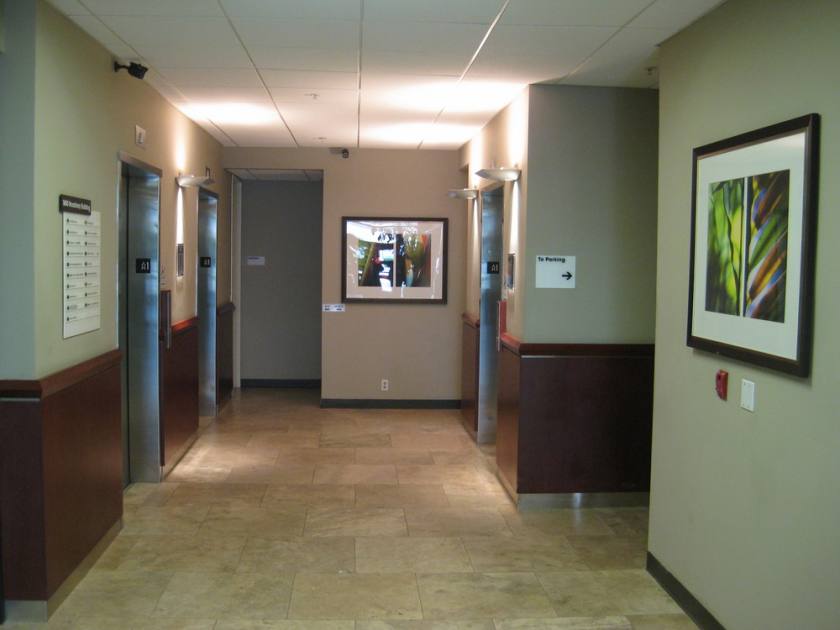
Additional Photos


Listing Agents

Anthony Ying
O: 714-558-0305
M: 714-421-2258
tying@svn.com
O: 714-558-0305
M: 714-421-2258
tying@svn.com
While we strive to provide the most accurate information, all listing information, and demographic data, is provided by third-parties. As such, MyEListing will not be responsible for the accuracy of the information. It is strongly recommended that you verify all information with the listing agent, and any relevant agencies, prior to making any decisions.