Industrial Properties
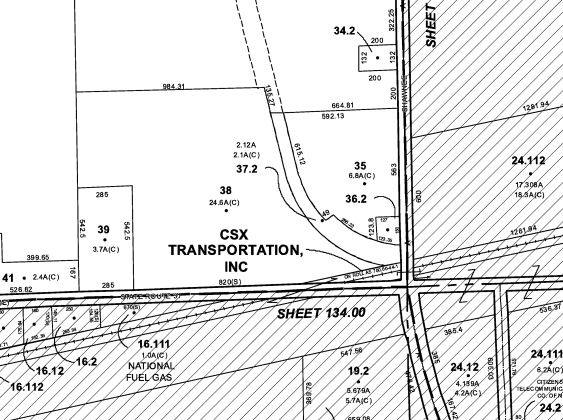
5700 Shawnee Road Sanborn, NY 14132
5700 Shawnee Road Sanborn, NY 14132

Details & Description
Property Highlights
- • 5 Buildings
- • 13,357+/- Total SF
- • 20' Ceiling Height
- • Two 16' Drive Through Doors
- • Electricity, Water , Gas on Property
Additional Photos


Listing Agents

Rick Recckio
O: 716-631-5555
M: 716-998-4422
rick@recckio.com
O: 716-631-5555
M: 716-998-4422
rick@recckio.com
While we strive to provide the most accurate information, all listing information, and demographic data, is provided by third-parties. As such, MyEListing will not be responsible for the accuracy of the information. It is strongly recommended that you verify all information with the listing agent, and any relevant agencies, prior to making any decisions.


