Flex-Office-Warehouse
174 East Steels Corners Road Stow, OH 44224
174 East Steels Corners Road Stow, OH 44224
Details & Description
Property Highlights
- • Built 1969 / Real Estate Taxes: $15,309 Annual
- • Summit County Parcel Number 3503638
- • Additional Land May be Available to Purchase
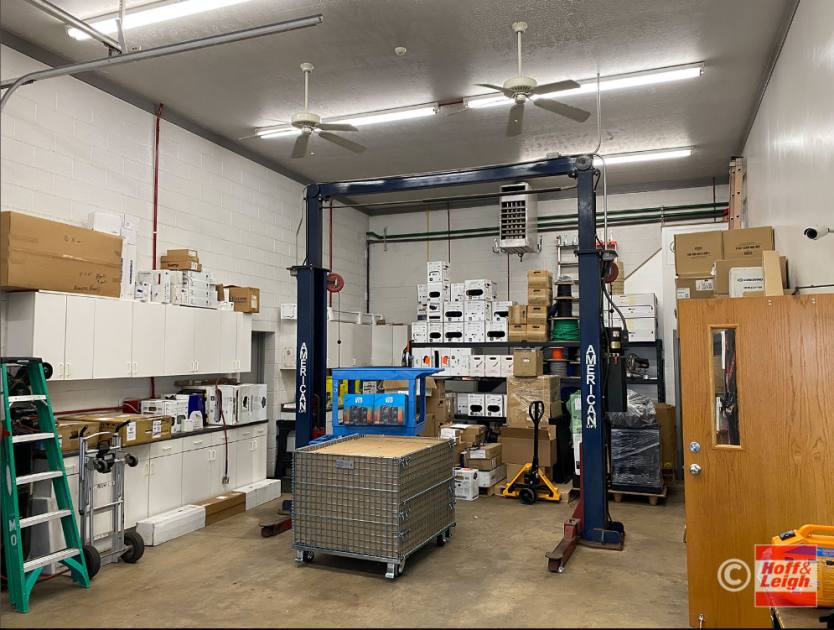
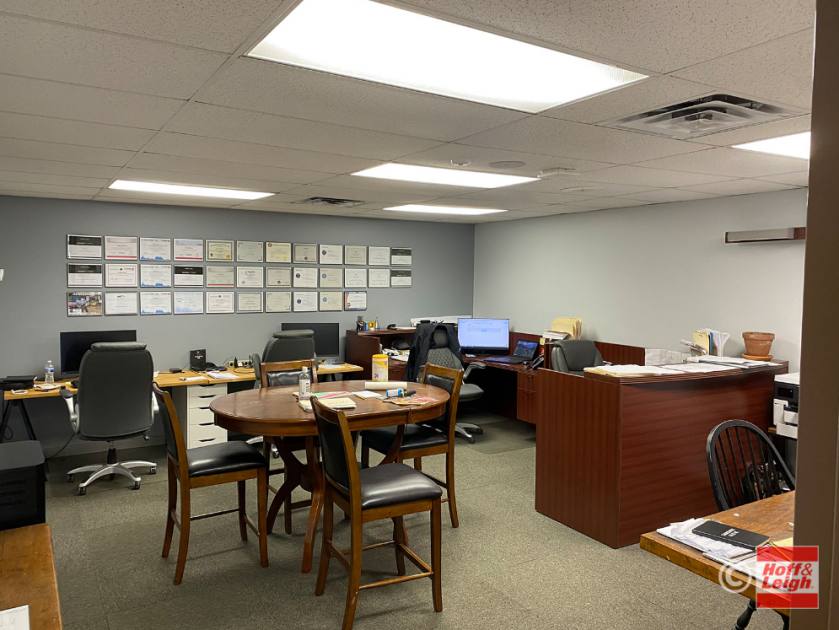
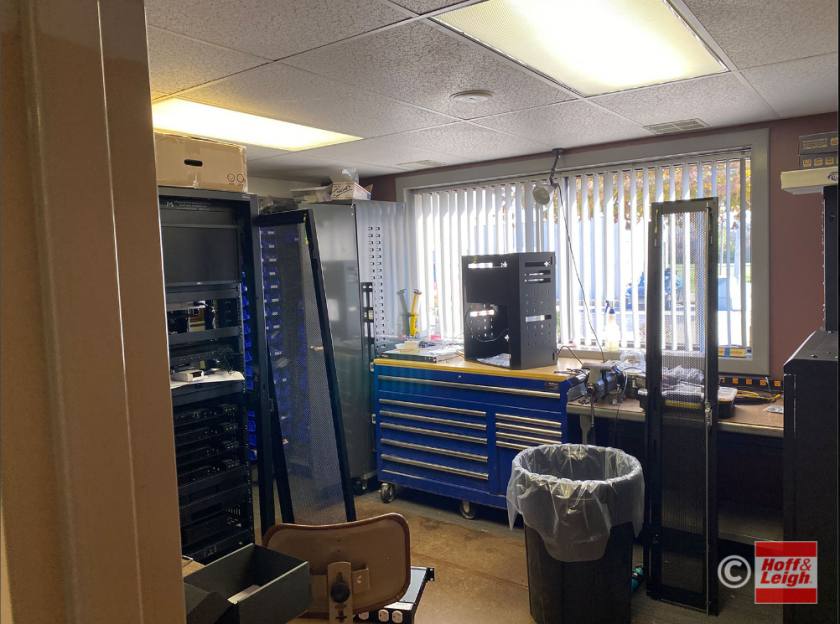
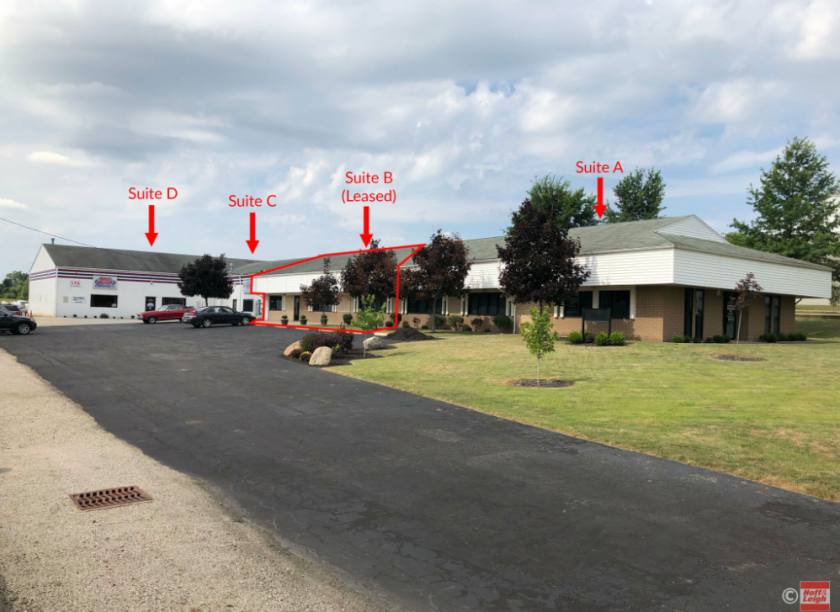
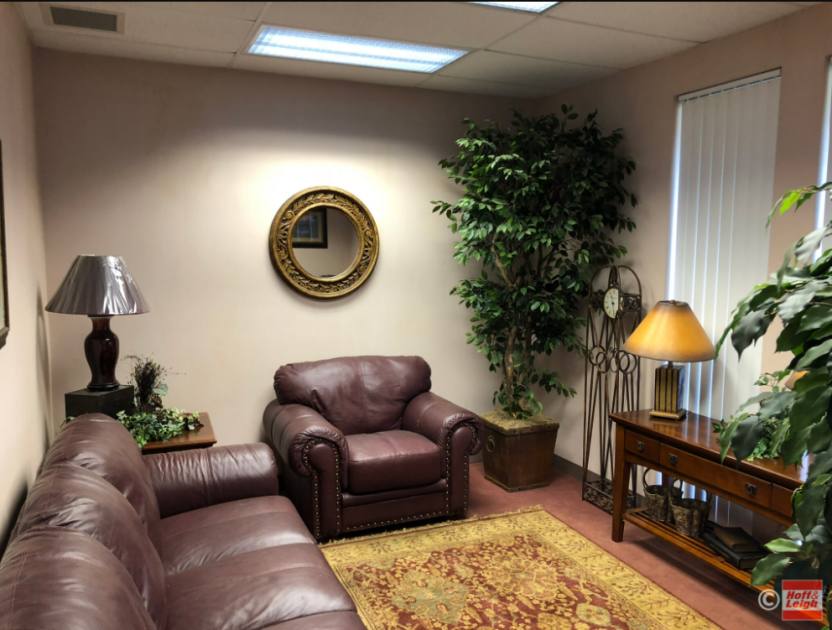
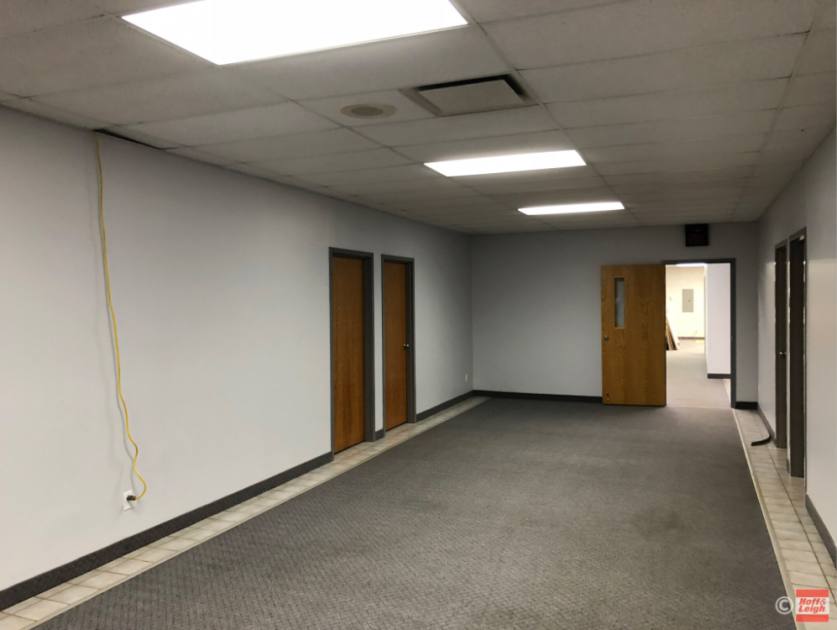
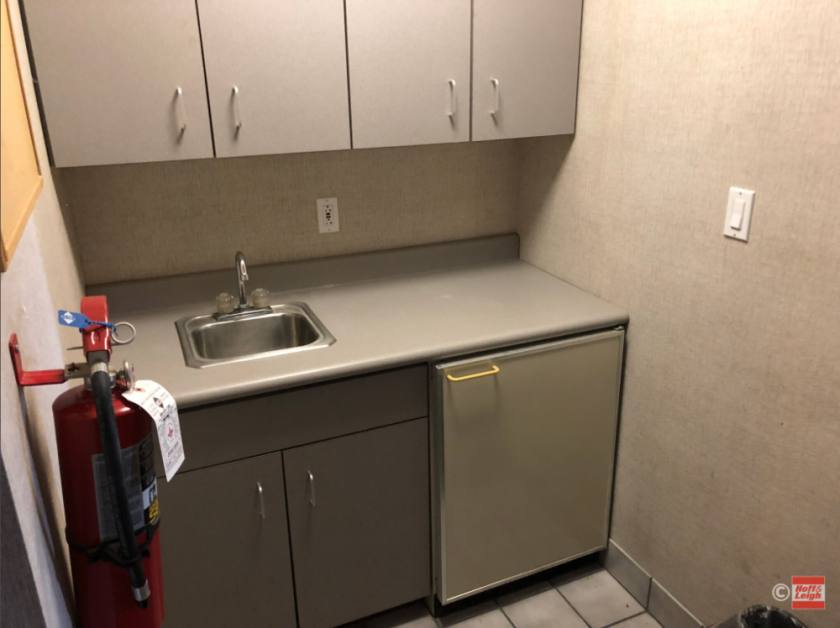
Additional Photos

Listing Agents

Debra Kaplan
O: 330-940-9360
M: 330-328-5594
debra@hoffleigh.com
O: 330-940-9360
M: 330-328-5594
debra@hoffleigh.com

David Kaplan
O: 330-940-9360
M: 330-338-5594
dkaplan@hoffleigh.com
O: 330-940-9360
M: 330-338-5594
dkaplan@hoffleigh.com
While we strive to provide the most accurate information, all listing information, and demographic data, is provided by third-parties. As such, MyEListing will not be responsible for the accuracy of the information. It is strongly recommended that you verify all information with the listing agent, and any relevant agencies, prior to making any decisions.