Commercial Land
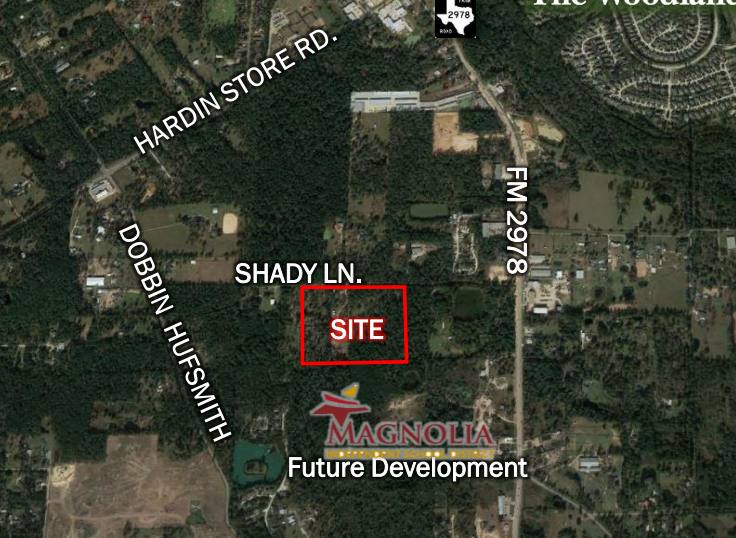
2003 Shady Lane Magnolia, TX 77354
2003 Shady Lane Magnolia, TX 77354
Details & Description
Property Highlights
- • Unrestricted
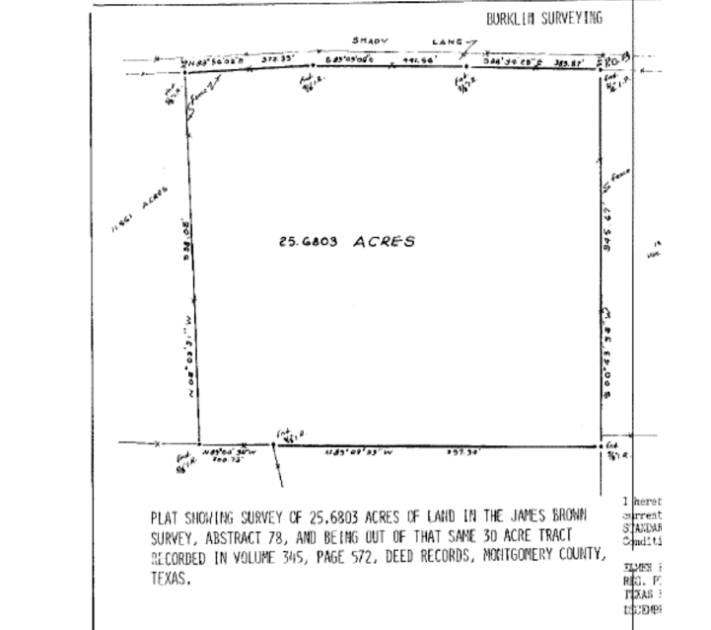
- • No Flood Plain
- • Traffic Counts: 24,725 CPD FM 2978
- • FM 2978 Widening to 5 Lanes
- • Up to ± 38 Acres Also Available
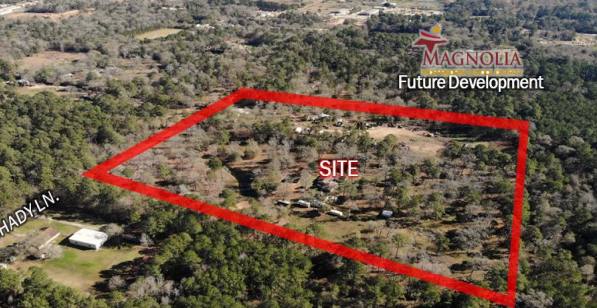
Additional Photos

Listing Agents

David Alexander
O: 281-210-3090
M: 281-210-0095
david@newcorcre.com
O: 281-210-3090
M: 281-210-0095
david@newcorcre.com
While we strive to provide the most accurate information, all listing information, and demographic data, is provided by third-parties. As such, MyEListing will not be responsible for the accuracy of the information. It is strongly recommended that you verify all information with the listing agent, and any relevant agencies, prior to making any decisions.


