Commercial Land
W Davis St Conroe, TX 77304
W Davis St Conroe, TX 77304
Details & Description
Property Highlights
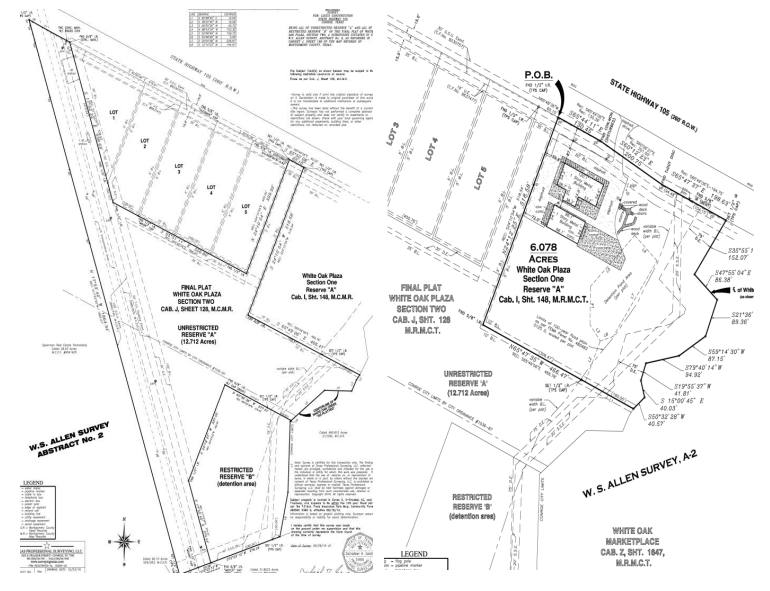
- • 12 Acres Net Developable
- • City Utilities
- • Retention Pond On Site
- • 1 Curb Cut in Place
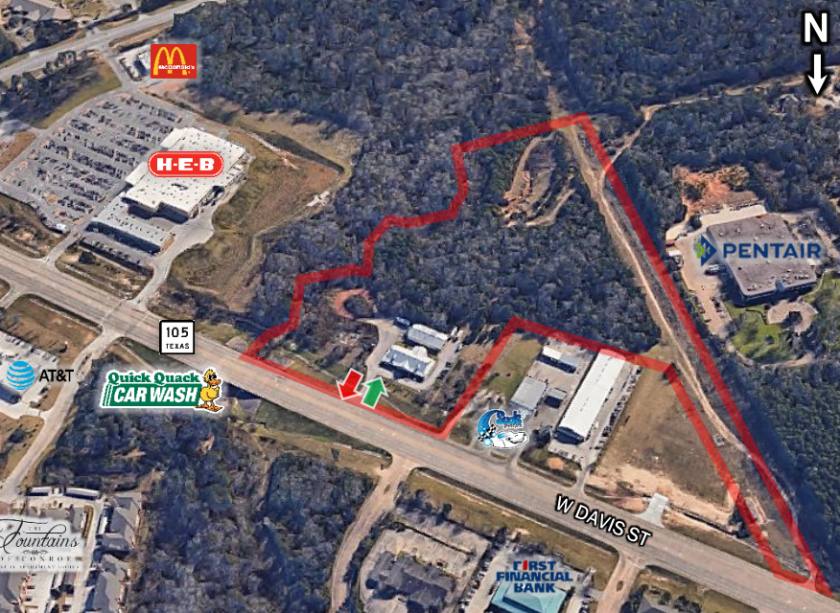
- • Located West of Highway 105 & Loop 336
- • 590’ Frontage on Highway 105
Listing Agents

David Alexander
O: 281-210-3090
M: 281-210-0095
david@newcorcre.com
O: 281-210-3090
M: 281-210-0095
david@newcorcre.com
While we strive to provide the most accurate information, all listing information, and demographic data, is provided by third-parties. As such, MyEListing will not be responsible for the accuracy of the information. It is strongly recommended that you verify all information with the listing agent, and any relevant agencies, prior to making any decisions.