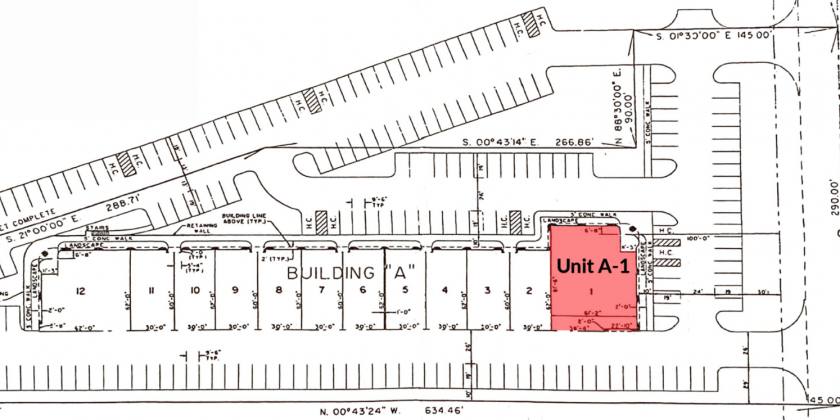
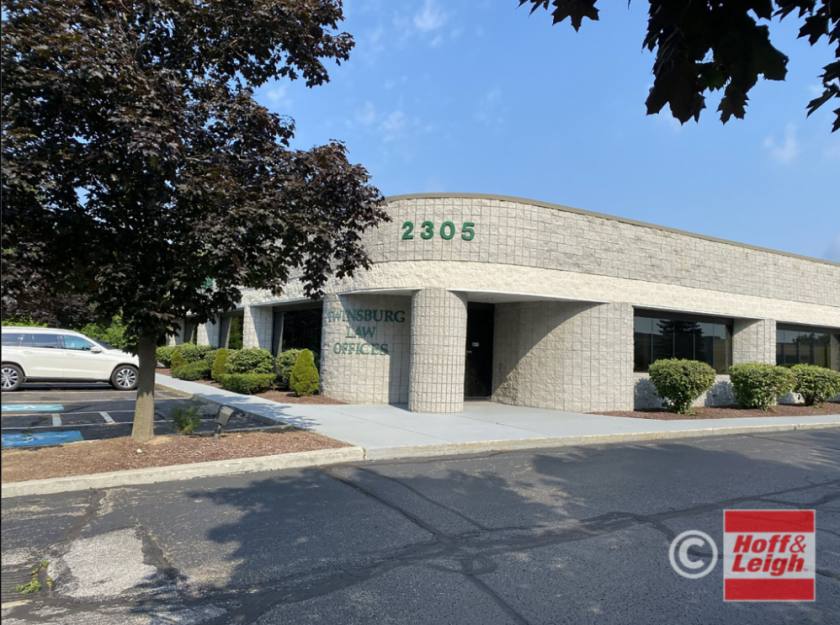
Flex-Office-Warehouse
2305 East Aurora Road Twinsburg, OH 44087
2305 East Aurora Road Twinsburg, OH 44087
Details & Description
Property Highlights
- • Plenty of Parking
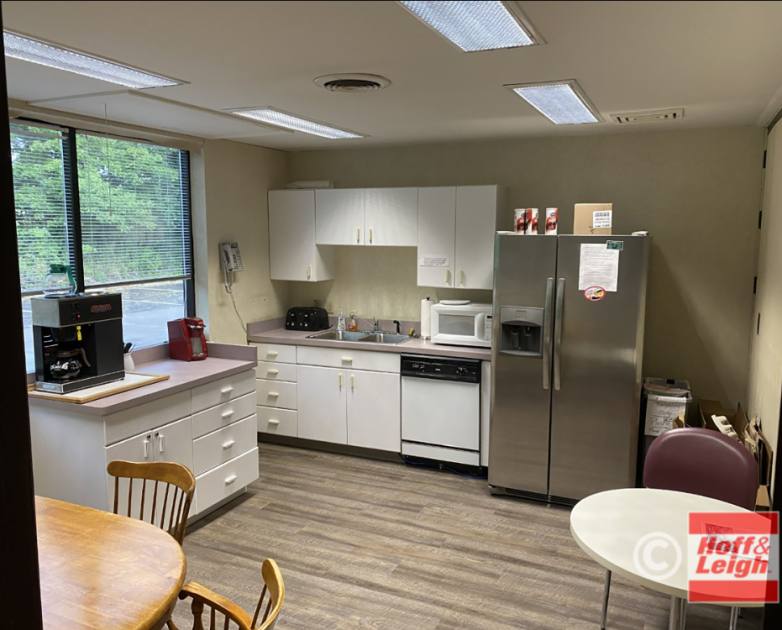
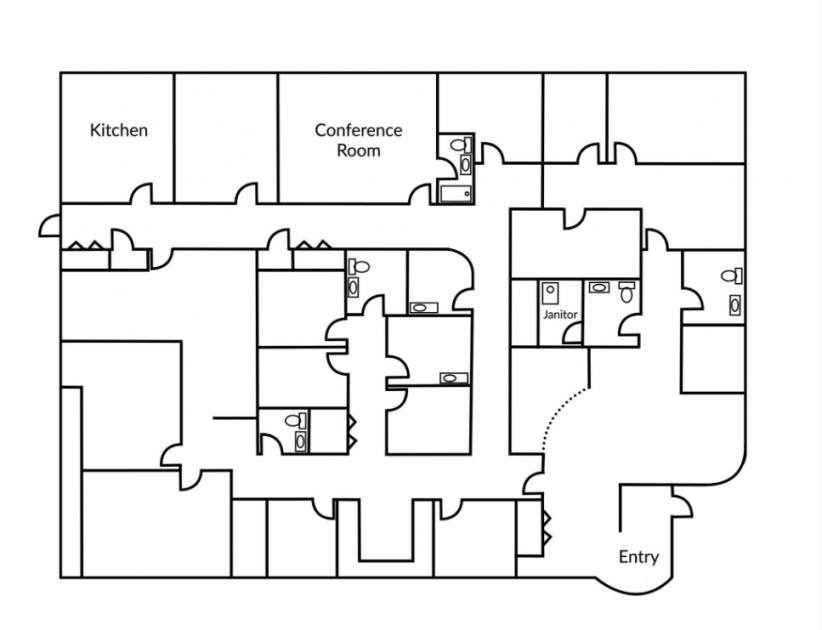
- • Kitchen, 4 Rest Rooms and Shower
- • New HVAC Unit Added 2022
- • Built 1993
- • Real Estate Taxes $8,000.00 Annual
- • Condo Fees $359.25 Monthly
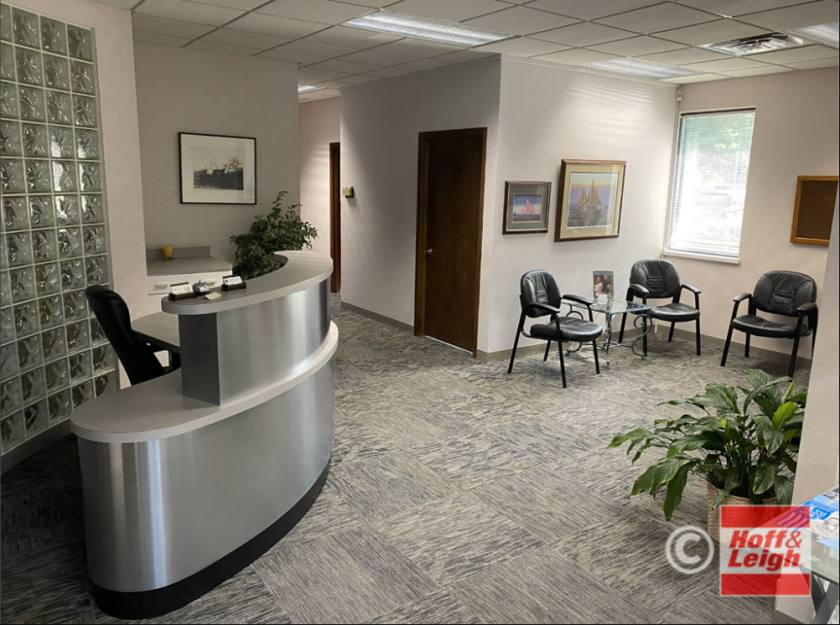
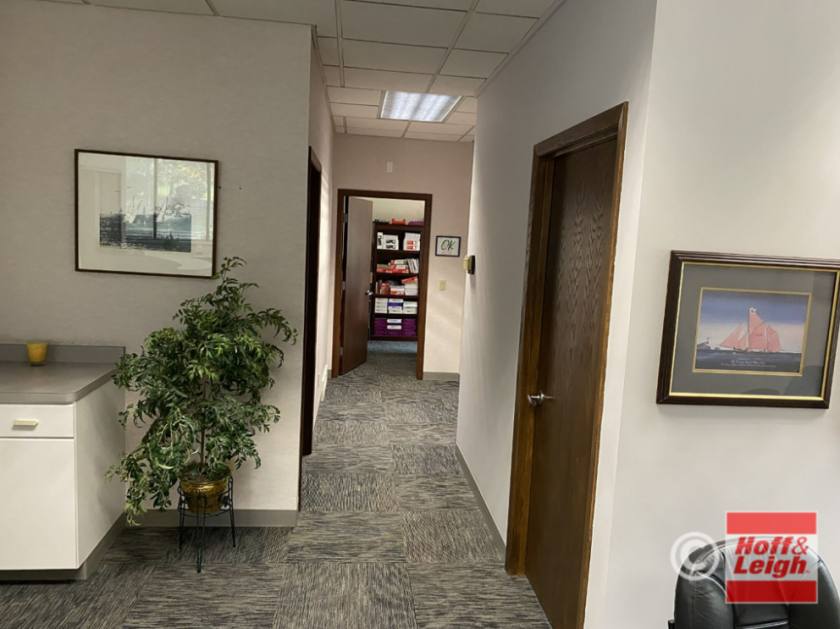
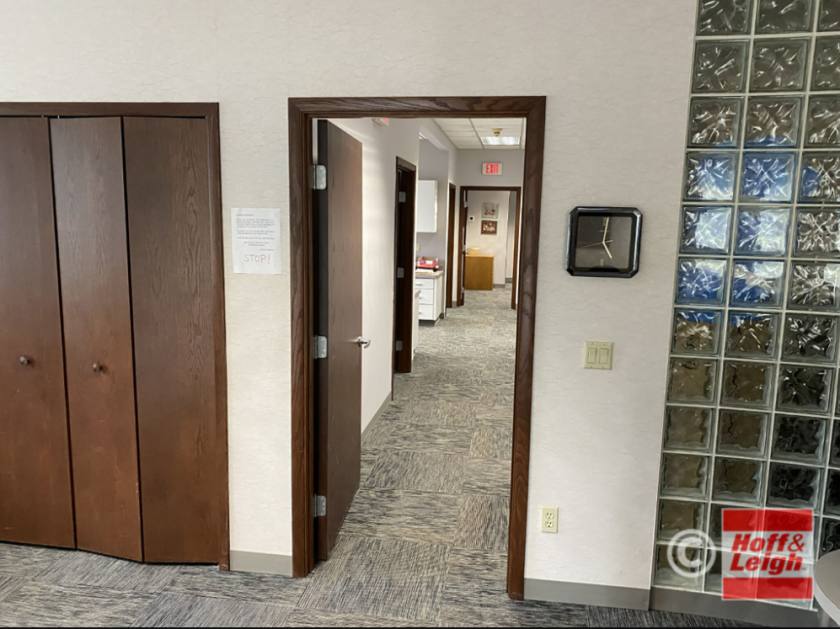
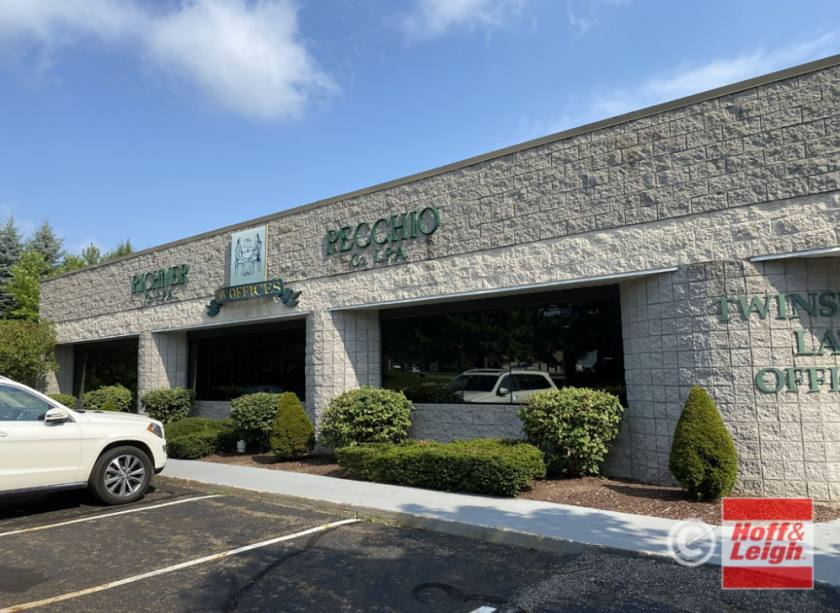
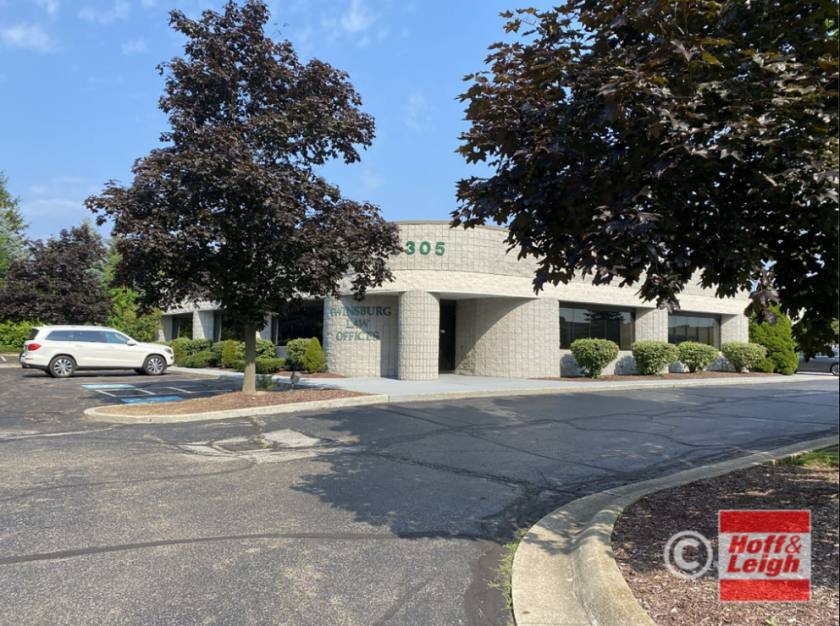
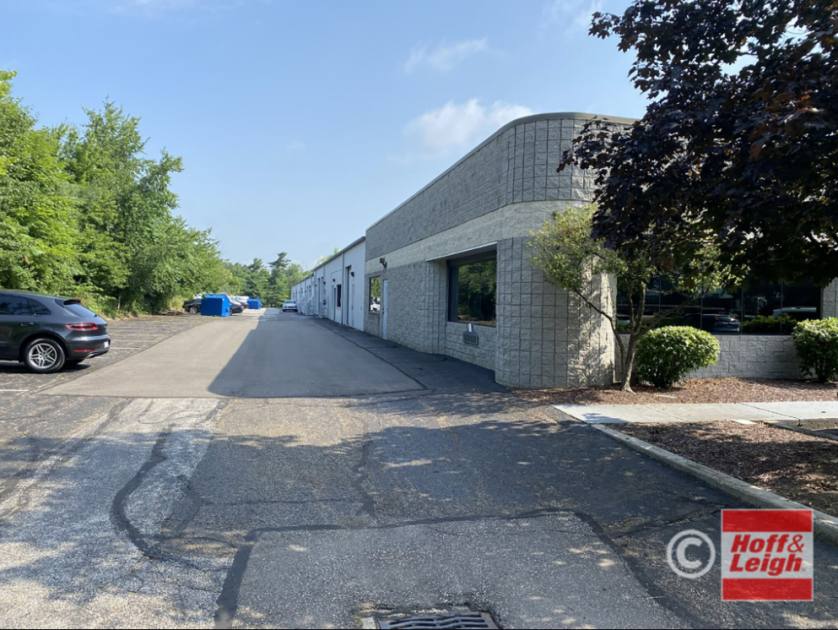
Additional Photos

Listing Agents

Debra Kaplan
O: 330-940-9360
M: 330-328-5594
debra@hoffleigh.com
O: 330-940-9360
M: 330-328-5594
debra@hoffleigh.com

David Kaplan
O: 330-940-9360
M: 330-338-5594
dkaplan@hoffleigh.com
O: 330-940-9360
M: 330-338-5594
dkaplan@hoffleigh.com
While we strive to provide the most accurate information, all listing information, and demographic data, is provided by third-parties. As such, MyEListing will not be responsible for the accuracy of the information. It is strongly recommended that you verify all information with the listing agent, and any relevant agencies, prior to making any decisions.