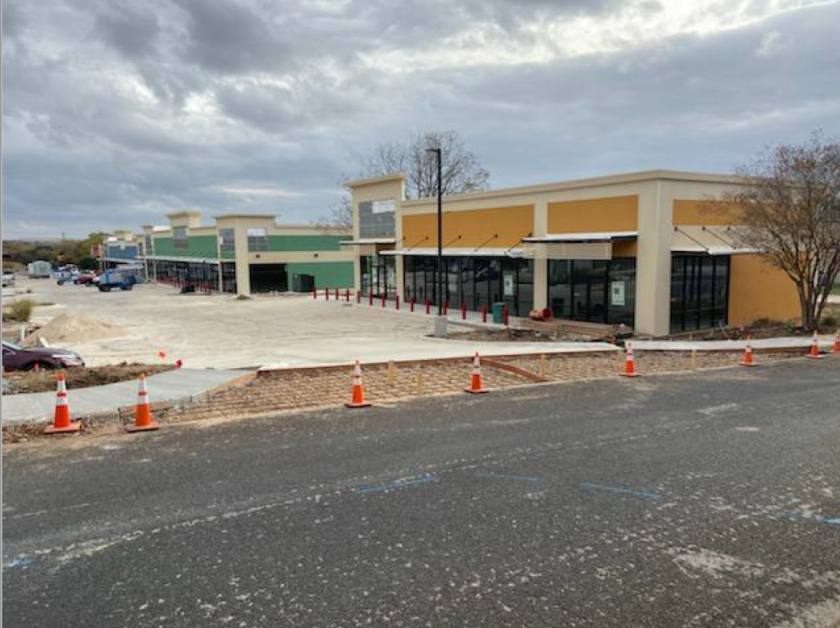
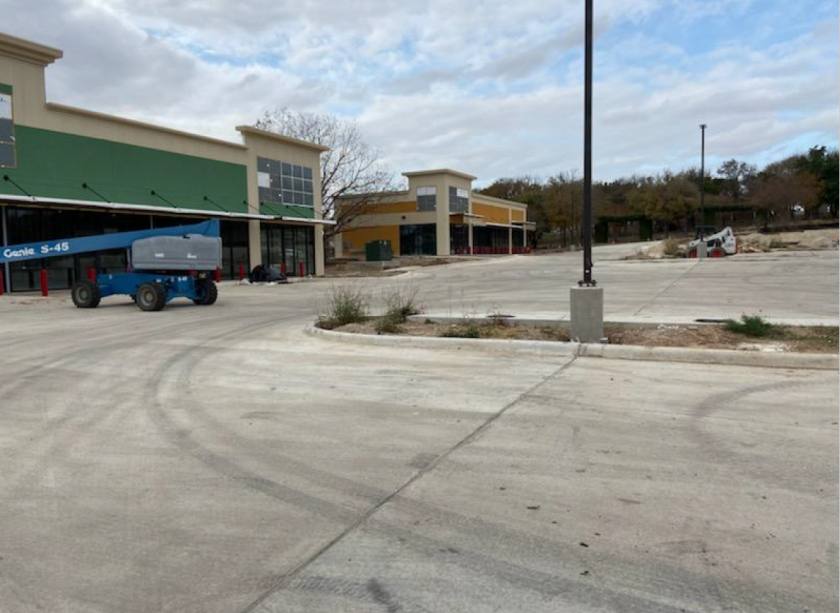
1-Mile | 3-Miles | 5-Miles | ||
---|---|---|---|---|
Total Population | 11,142 | 94,086 | 199,977 | |
Population Median Age | 32 | 35 | 36 | |
Population by Age | 0-9 Yrs | 1457 (13%) | 12324 (13%) | 24761 (12%) |
10-19 Yrs | 1247 (11%) | 8951 (9%) | 19622 (9%) | |
20-29 Yrs | 2374 (21%) | 18321 (19%) | 35711 (17%) | |
30-39 Yrs | 2735 (24%) | 19440 (20%) | 40377 (20%) | |
40-49 Yrs | 1491 (13%) | 13254 (14%) | 28551 (14%) | |
50-59 Yrs | 721 (6%) | 9449 (10%) | 21801 (10%) | |
60-69 Yrs | 654 (5%) | 7529 (8%) | 17313 (8%) | |
70+ Yrs | 464 (4%) | 4817 (5%) | 11842 (5%) | |
Median HH Income | $72,270 | $69,354 | $71,889 | |
Total Household Income | < 24K | 361 (7%) | 4546 (12%) | 10026 (12%) |
25-49K | 1027 (22%) | 8217 (22%) | 16486 (20%) | |
50-74K | 1045 (22%) | 7435 (20%) | 15272 (19%) | |
75-99K | 974 (20%) | 6083 (16%) | 11558 (14%) | |
100-199K | 1092 (23%) | 8908 (24%) | 21109 (26%) | |
200K+ | 140 (3%) | 1909 (5%) | 5233 (6%) | |
Highest Education Level | No Diploma | 812 | 9370 | 17279 |
Diploma or GED | 1205 | 13687 | 27471 | |
Some College | 1907 | 14004 | 30065 | |
Assoc. Degree | 706 | 4509 | 9012 | |
Bachelors Degree | 2243 | 17908 | 41728 | |
Higher Degree | 739 | 6805 | 17441 | |
Total Housing Units | 4,963 | 39,170 | 84,197 | |
--Owner-Occupied | 1,744 | 17,871 | 40,359 | |
--Renter-Occupied | 2,894 | 19,226 | 39,326 | |
Owner-Occupied Values | < 100K | 265 | 1356 | 1999 |
100-199K | 137 | 3890 | 6081 | |
200-299K | 685 | 6874 | 14818 | |
300-399K | 543 | 4375 | 12128 | |
400-499K | 89 | 1093 | 3827 | |
500K+ | 26 | 283 | 1507 | |
Total Working Age Population | 8,977 | 76,184 | 163,092 | |
In Work Force | 7,316 | 58,908 | 123,914 | |
Not In Work Force | 1,661 | 17,277 | 39,178 | |
Workforce Employed | 6,904 | 56,384 | 118,898 | |
Workforce Unemployed | 400 | 2,445 | 4,903 | |
Civlian Workforce | 7,304 | 58,830 | 123,802 | |
Military Workforce | 12 | 78 | 112 | |
Total Households | 4,639 | 37,097 | 79,686 | |
Family Households | 2,324 | 21,057 | 44,657 | |
Non-Family Households | 2,315 | 16,040 | 35,029 | |
Married Couple | 1,586 | 14,127 | 30,790 | |
Other Family | 737 | 6,929 | 13,867 | |
Married w/Child | 808 | 6,053 | 13,058 | |
Single Male w/Child | 106 | 629 | 1,573 | |
Single Female w/Child | 230 | 2,439 | 5,046 |
Population Change Last Two Decades - Plus Projection
2000 | % | 2010 | % | 2020 | % | 2030 | |
---|---|---|---|---|---|---|---|
Texas | 20,851,820 | +21 | 25,145,561 | +18 | 29,677,668 | +18 | 34,894,452 |
Travis County | 812,280 | +26 | 1,024,266 | +26 | 1,291,502 | +19 | 1,540,812 |
Hays County | 97,589 | +61 | 157,107 | +50 | 234,896 | +48 | 347,120 |
Total Working Age Population:
Total Households:
Total Working Age Population:
Total Households:
Total Working Age Population:
Total Households: