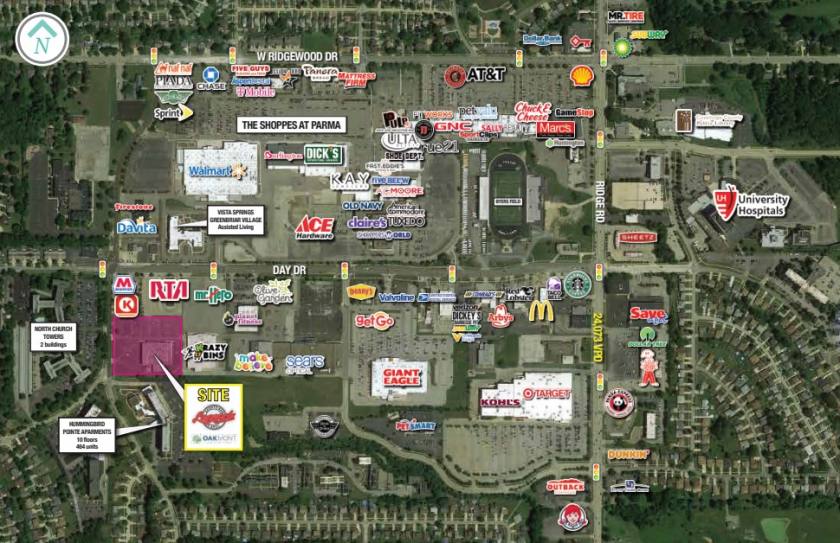
1-Mile | 3-Miles | 5-Miles | ||
---|---|---|---|---|
Total Population | 15,521 | 101,052 | 241,448 | |
Population Median Age | 42 | 42 | 42 | |
Population by Age | 0-9 Yrs | 1694 (10%) | 9983 (9%) | 24911 (10%) |
10-19 Yrs | 1619 (10%) | 10700 (10%) | 25647 (10%) | |
20-29 Yrs | 2552 (16%) | 13760 (13%) | 32669 (13%) | |
30-39 Yrs | 1683 (10%) | 12434 (12%) | 30942 (12%) | |
40-49 Yrs | 1685 (10%) | 11858 (11%) | 27761 (11%) | |
50-59 Yrs | 2175 (14%) | 14815 (14%) | 36039 (14%) | |
60-69 Yrs | 1663 (10%) | 13251 (13%) | 31799 (13%) | |
70+ Yrs | 2451 (15%) | 14252 (14%) | 31679 (13%) | |
Median HH Income | $47,288 | $59,514 | $57,545 | |
Total Household Income | < 24K | 1380 (20%) | 7050 (16%) | 19194 (18%) |
25-49K | 2107 (31%) | 10811 (24%) | 26349 (25%) | |
50-74K | 1232 (18%) | 9518 (21%) | 21804 (20%) | |
75-99K | 821 (12%) | 6627 (15%) | 14616 (13%) | |
100-199K | 987 (14%) | 8445 (19%) | 19701 (18%) | |
200K+ | 81 (1%) | 824 (1%) | 3088 (2%) | |
Highest Education Level | No Diploma | 1184 | 6196 | 16206 |
Diploma or GED | 4077 | 25826 | 59556 | |
Some College | 2065 | 16515 | 39479 | |
Assoc. Degree | 1222 | 7860 | 15993 | |
Bachelors Degree | 1712 | 12325 | 30442 | |
Higher Degree | 869 | 5446 | 14500 | |
Total Housing Units | 7,429 | 46,179 | 111,852 | |
--Owner-Occupied | 3,639 | 30,286 | 70,708 | |
--Renter-Occupied | 2,970 | 12,990 | 34,044 | |
Owner-Occupied Values | < 100K | 768 | 7142 | 20729 |
100-199K | 2713 | 20101 | 38294 | |
200-299K | 127 | 2530 | 8515 | |
300-399K | 30 | 368 | 1953 | |
400-499K | 0 | 54 | 715 | |
500K+ | 1 | 92 | 503 | |
Total Working Age Population | 13,067 | 84,947 | 201,436 | |
In Work Force | 8,302 | 55,325 | 131,279 | |
Not In Work Force | 4,765 | 29,621 | 70,157 | |
Workforce Employed | 7,356 | 51,991 | 123,070 | |
Workforce Unemployed | 946 | 3,320 | 8,177 | |
Civlian Workforce | 8,302 | 55,311 | 131,248 | |
Military Workforce | 0 | 14 | 31 | |
Total Households | 6,609 | 43,276 | 104,753 | |
Family Households | 3,744 | 26,299 | 62,080 | |
Non-Family Households | 2,865 | 16,977 | 42,672 | |
Married Couple | 2,277 | 18,858 | 43,606 | |
Other Family | 1,467 | 7,441 | 18,474 | |
Married w/Child | 655 | 6,125 | 14,287 | |
Single Male w/Child | 145 | 856 | 2,669 | |
Single Female w/Child | 623 | 2,279 | 6,030 |
Population Change Last Two Decades - Plus Projection
2000 | % | 2010 | % | 2020 | % | 2030 | |
---|---|---|---|---|---|---|---|
Ohio | 11,353,140 | +2 | 11,536,504 | 0 | 11,574,870 | 0 | 11,615,100 |
Cuyahoga County | 1,393,978 | -8 | 1,280,122 | -6 | 1,209,550 | -5 | 1,154,210 |
Total Working Age Population:
Total Households:
Total Working Age Population:
Total Households:
Total Working Age Population:
Total Households: