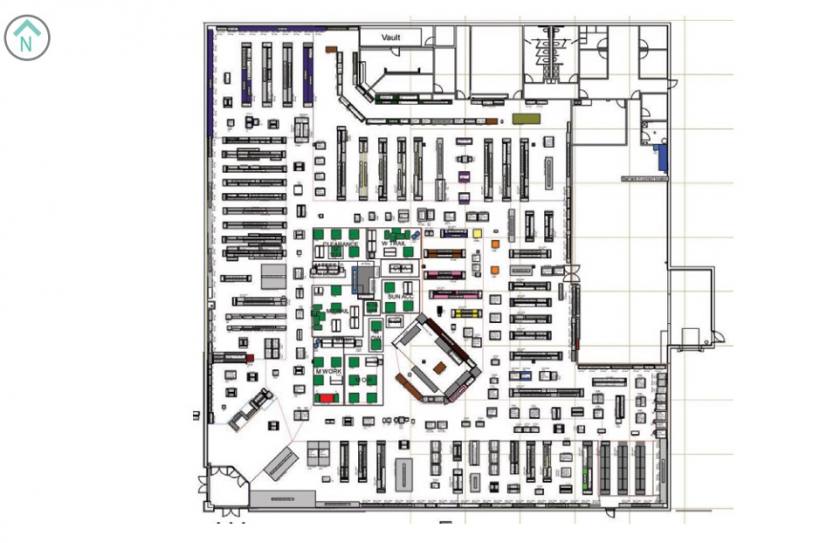
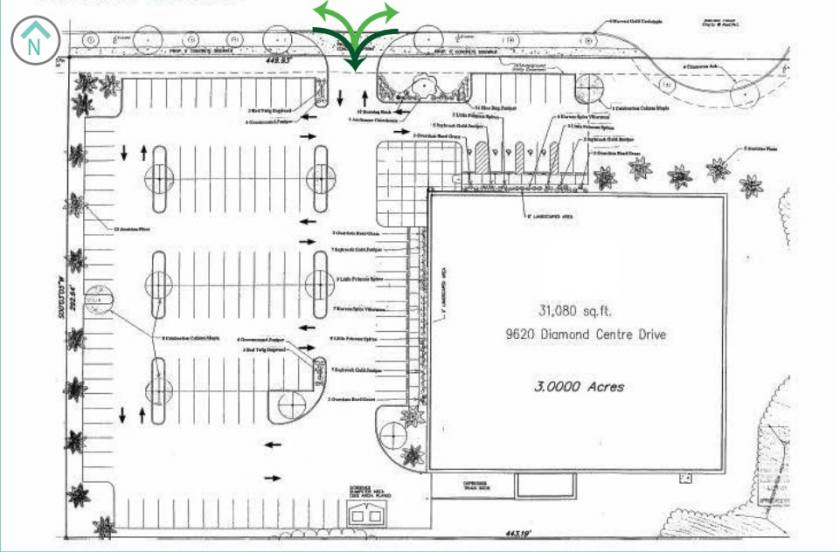
1-Mile | 3-Miles | 5-Miles | ||
---|---|---|---|---|
Total Population | 4,013 | 48,564 | 96,316 | |
Population Median Age | 37 | 41 | 42 | |
Population by Age | 0-9 Yrs | 592 (14%) | 5583 (11%) | 11109 (11%) |
10-19 Yrs | 456 (11%) | 6506 (13%) | 11861 (12%) | |
20-29 Yrs | 638 (15%) | 5666 (11%) | 10385 (10%) | |
30-39 Yrs | 650 (16%) | 5791 (11%) | 11104 (11%) | |
40-49 Yrs | 442 (11%) | 6443 (13%) | 11853 (12%) | |
50-59 Yrs | 405 (10%) | 6153 (12%) | 13568 (14%) | |
60-69 Yrs | 471 (11%) | 6220 (12%) | 13560 (14%) | |
70+ Yrs | 358 (8%) | 6201 (12%) | 12876 (13%) | |
Median HH Income | $83,744 | $65,209 | $68,740 | |
Total Household Income | < 24K | 161 (9%) | 3002 (15%) | 5811 (14%) |
25-49K | 273 (16%) | 4142 (21%) | 8287 (21%) | |
50-74K | 263 (16%) | 3846 (20%) | 7152 (18%) | |
75-99K | 355 (21%) | 3038 (15%) | 6228 (15%) | |
100-199K | 526 (32%) | 4451 (23%) | 9499 (24%) | |
200K+ | 64 (3%) | 659 (3%) | 2104 (5%) | |
Highest Education Level | No Diploma | 100 | 3072 | 5325 |
Diploma or GED | 762 | 10874 | 20675 | |
Some College | 637 | 7439 | 15141 | |
Assoc. Degree | 224 | 3204 | 6723 | |
Bachelors Degree | 661 | 5389 | 12763 | |
Higher Degree | 360 | 3626 | 7652 | |
Total Housing Units | 1,757 | 20,584 | 41,742 | |
--Owner-Occupied | 1,015 | 13,660 | 29,318 | |
--Renter-Occupied | 626 | 5,477 | 9,764 | |
Owner-Occupied Values | < 100K | 93 | 3058 | 5043 |
100-199K | 279 | 5818 | 13072 | |
200-299K | 551 | 3949 | 8246 | |
300-399K | 63 | 559 | 1964 | |
400-499K | 21 | 162 | 512 | |
500K+ | 8 | 115 | 480 | |
Total Working Age Population | 3,079 | 38,921 | 78,021 | |
In Work Force | 2,290 | 24,473 | 49,278 | |
Not In Work Force | 790 | 14,448 | 28,743 | |
Workforce Employed | 2,212 | 23,176 | 47,064 | |
Workforce Unemployed | 76 | 1,281 | 2,183 | |
Civlian Workforce | 2,288 | 24,457 | 49,246 | |
Military Workforce | 1 | 16 | 32 | |
Total Households | 1,641 | 19,138 | 39,081 | |
Family Households | 1,094 | 12,178 | 24,923 | |
Non-Family Households | 547 | 6,960 | 14,159 | |
Married Couple | 864 | 8,935 | 19,011 | |
Other Family | 230 | 3,243 | 5,911 | |
Married w/Child | 368 | 3,088 | 6,644 | |
Single Male w/Child | 49 | 501 | 897 | |
Single Female w/Child | 125 | 1,297 | 2,078 |
Population Change Last Two Decades - Plus Projection
2000 | % | 2010 | % | 2020 | % | 2030 | |
---|---|---|---|---|---|---|---|
Ohio | 11,353,140 | +2 | 11,536,504 | 0 | 11,574,870 | 0 | 11,615,100 |
Lake County | 227,511 | +1 | 230,041 | -1 | 228,600 | 0 | 228,380 |
Total Working Age Population:
Total Households:
Total Working Age Population:
Total Households:
Total Working Age Population:
Total Households: