Retail Space
450 Pike Street Marietta, OH 45750
450 Pike Street Marietta, OH 45750
Details & Description
Property Highlights
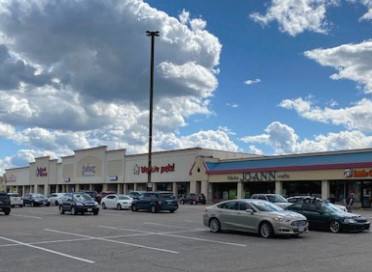
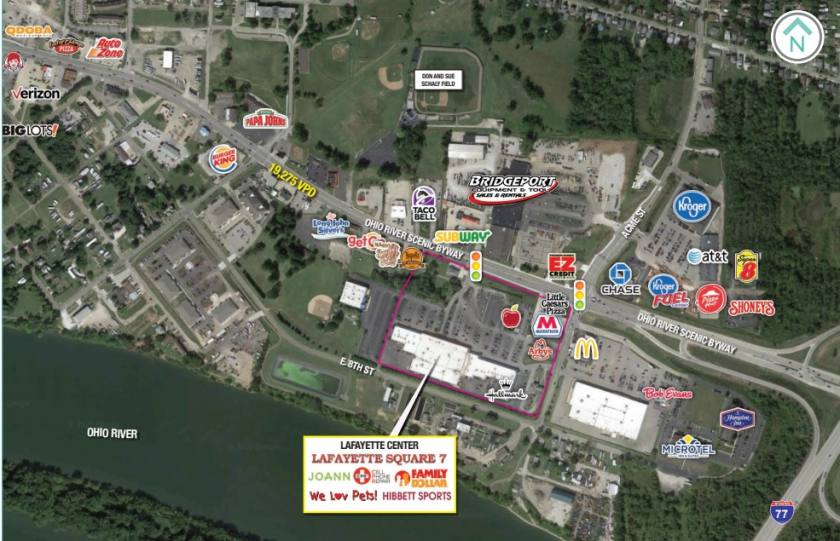
- • Excellent Visibility
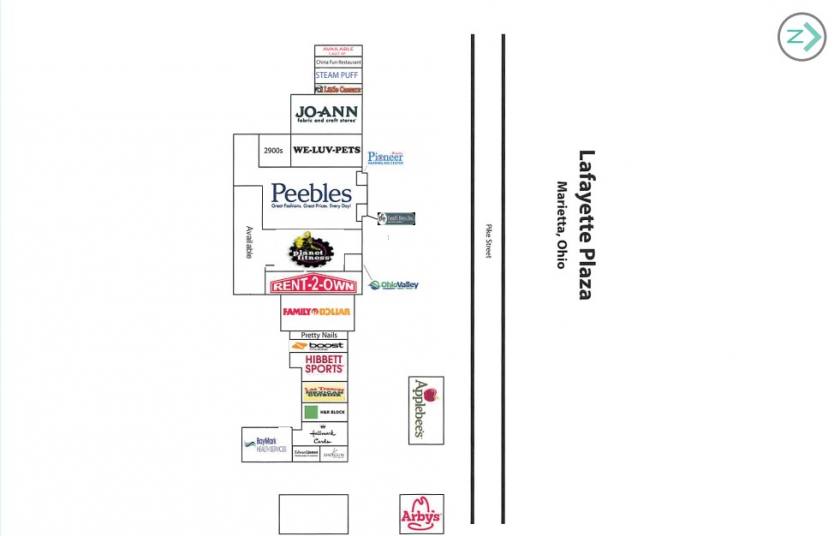
- • Pylon signage available
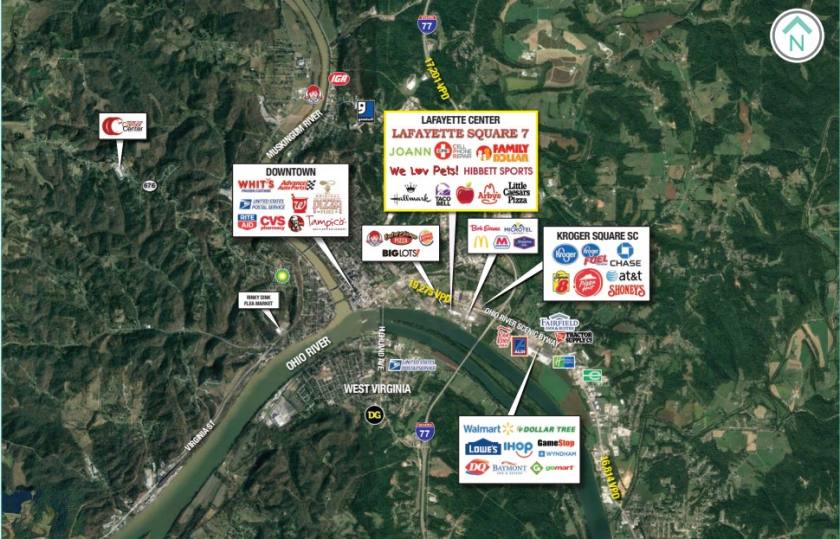
- • Near I-77
Additional Photos
Listing Agents

Matt Wilson
M: 216-470-8200
mwilson@anchorretail.com
M: 216-470-8200
mwilson@anchorretail.com

Ben McMillon
O: 216-342-2607
M: 440-725-6551
ben@blmcmillon.com
O: 216-342-2607
M: 440-725-6551
ben@blmcmillon.com
While we strive to provide the most accurate information, all listing information, and demographic data, is provided by third-parties. As such, MyEListing will not be responsible for the accuracy of the information. It is strongly recommended that you verify all information with the listing agent, and any relevant agencies, prior to making any decisions.


