Retail Space
5310 North Leavitt Road Lorain, OH 44053
5310 North Leavitt Road Lorain, OH 44053
Details & Description
Property Highlights
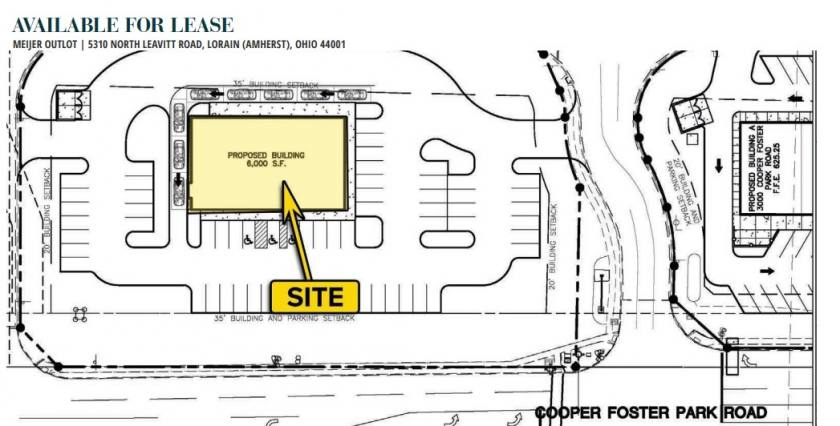
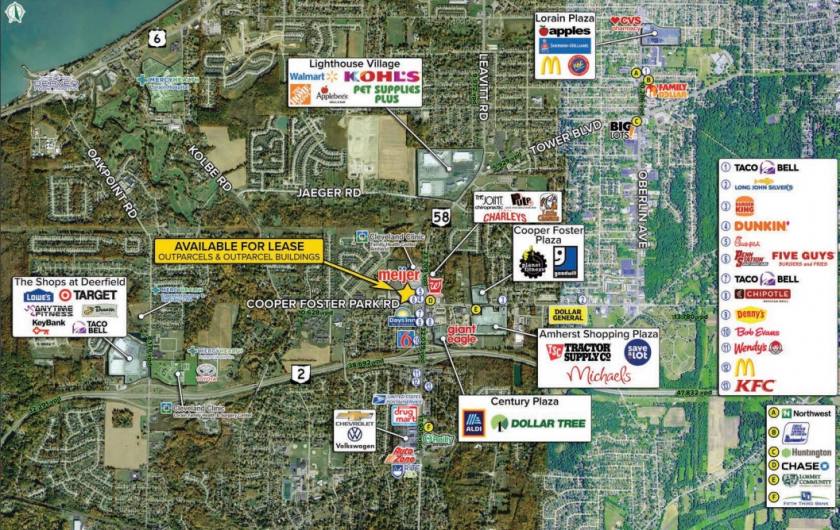
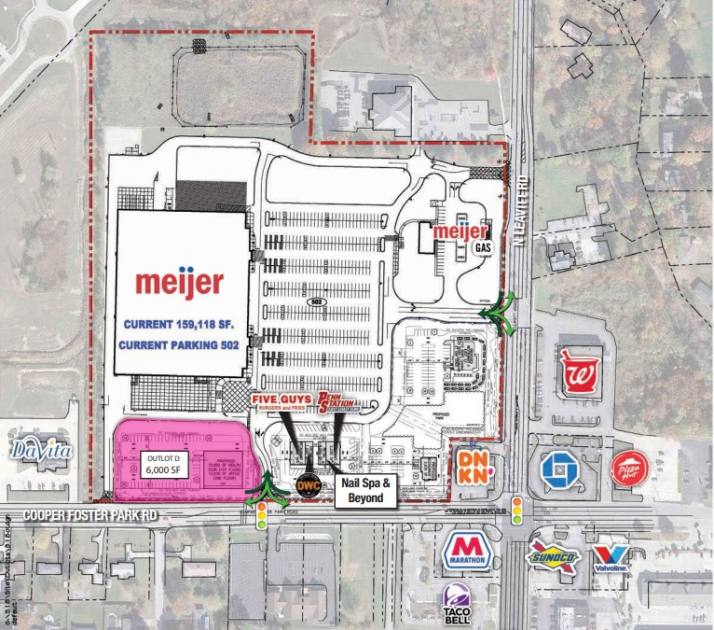
• Outparcels and outparcel buildings available for lease located in front of brand new Meijer!
• 2,600 SF free-Standing, end-cap and in-line spaces available
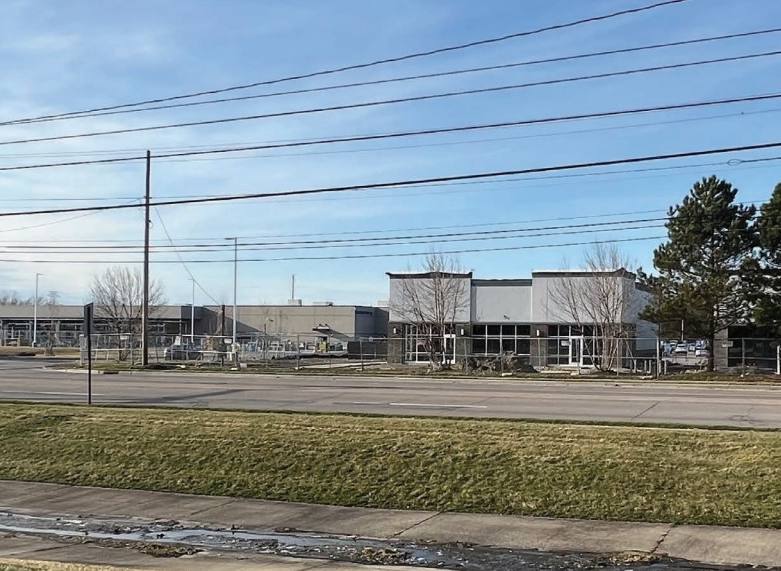
Additional Photos
Listing Agents

Tori Nook
O: 216-342-2550
M: 216-269-5624
tnook@anchorretail.com
O: 216-342-2550
M: 216-269-5624
tnook@anchorretail.com

Allison Giomuso
O: 216-342-2620
M: 440-364-5626
agiomuso@anchorretail.com
O: 216-342-2620
M: 440-364-5626
agiomuso@anchorretail.com

Jimmy DiFonzo
O: 216-342-2676
M: 440-856-3900
jdifonzo@anchorretail.com
O: 216-342-2676
M: 440-856-3900
jdifonzo@anchorretail.com
While we strive to provide the most accurate information, all listing information, and demographic data, is provided by third-parties. As such, MyEListing will not be responsible for the accuracy of the information. It is strongly recommended that you verify all information with the listing agent, and any relevant agencies, prior to making any decisions.


