Retail Space
16620 Royalton Road Strongsville, OH 44136
16620 Royalton Road Strongsville, OH 44136
Details & Description
Property Highlights
• Zoning: MS- Motorist Service. The only zoning in the City that allows for auto service, sales, and fueling stations.
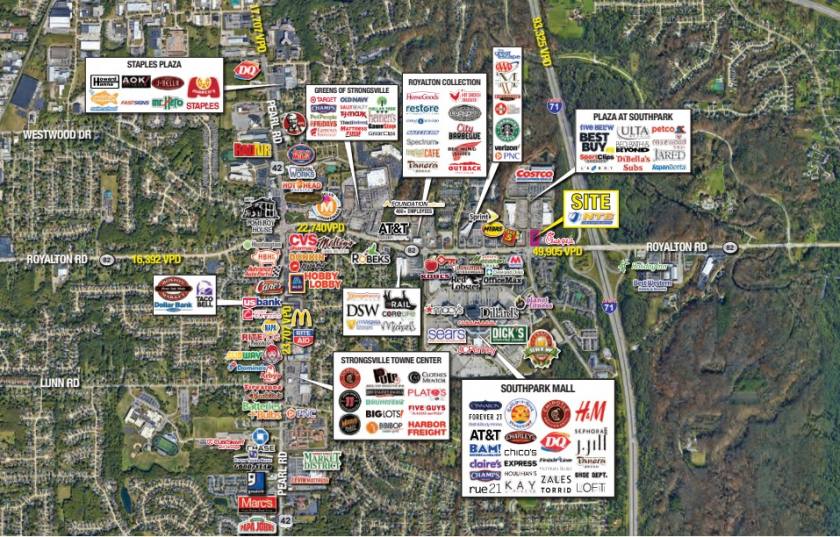
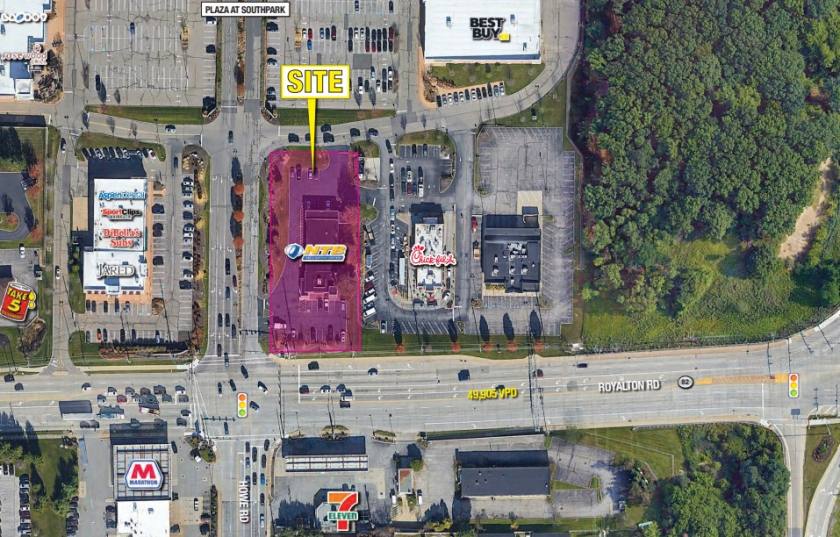
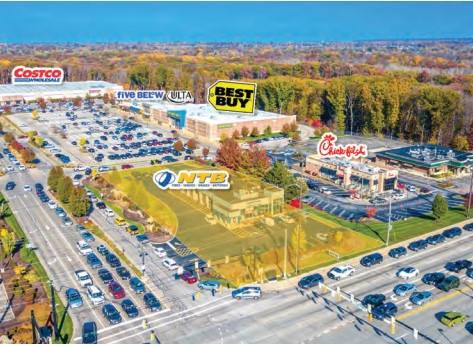
• Under 1,000 ft from the I-71 South exit ramp with a 50,000 VPD traffic count on Royalton Rd (SR-82)
Listing Agents

Greg Guyuron
O: 216-342-2564
M: 440-821-4770
gguyuron@anchorretail.com
O: 216-342-2564
M: 440-821-4770
gguyuron@anchorretail.com
While we strive to provide the most accurate information, all listing information, and demographic data, is provided by third-parties. As such, MyEListing will not be responsible for the accuracy of the information. It is strongly recommended that you verify all information with the listing agent, and any relevant agencies, prior to making any decisions.