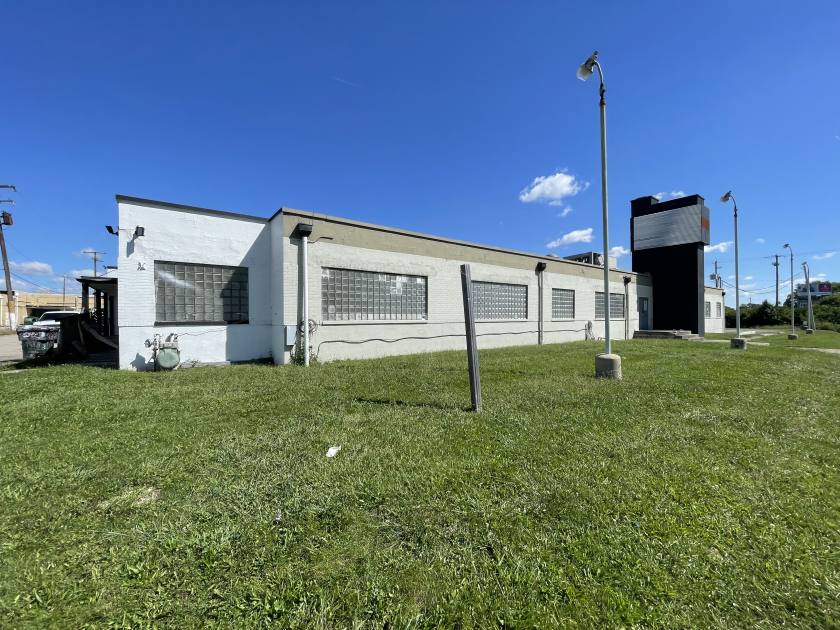
Flex-Office-Warehouse
3440 West Broad Street Columbus, OH 43204
3440 West Broad Street Columbus, OH 43204

Details & Description
Property Highlights
- • Highly visible corner location
- • Situated in an opportunity zone
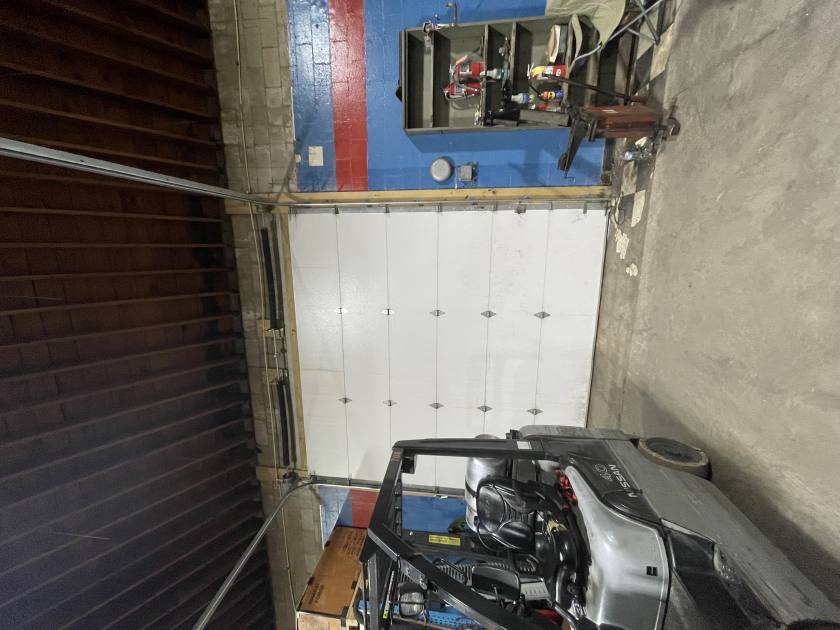
- • One 12’ drive-in door
- • 14’ ceiling with 12’ drop
- • Easy access to major roads
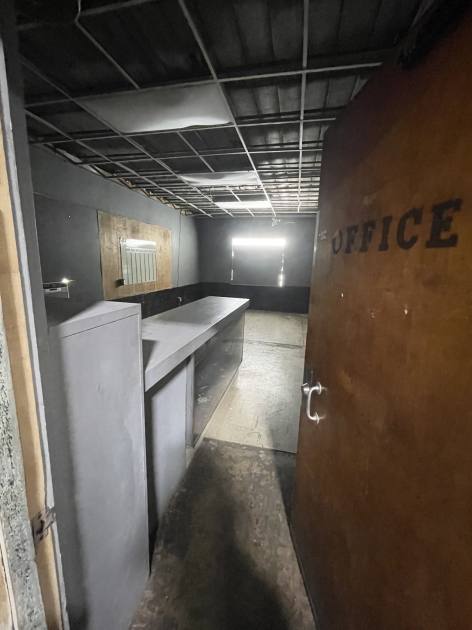
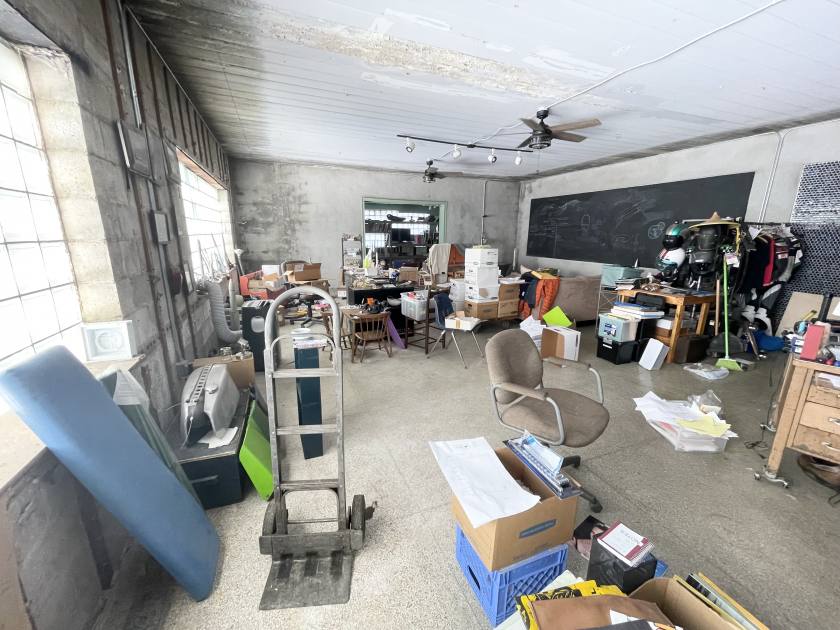
Additional Photos


Listing Agents

Julie Cohen
O: 614-221-4286
M: 614-643-2654
jcohen@rweiler.com
O: 614-221-4286
M: 614-643-2654
jcohen@rweiler.com
While we strive to provide the most accurate information, all listing information, and demographic data, is provided by third-parties. As such, MyEListing will not be responsible for the accuracy of the information. It is strongly recommended that you verify all information with the listing agent, and any relevant agencies, prior to making any decisions.