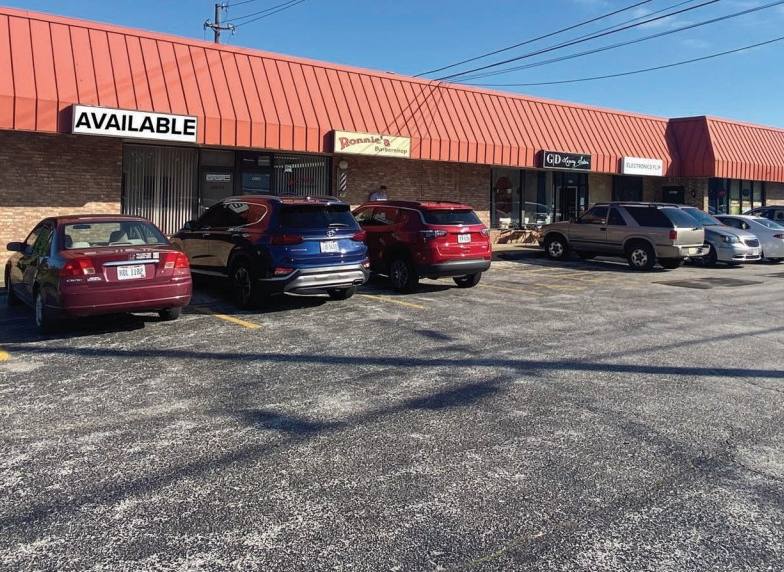
1-Mile | 3-Miles | 5-Miles | ||
---|---|---|---|---|
Total Population | 13,170 | 58,446 | 114,283 | |
Population Median Age | 41 | 43 | 42 | |
Population by Age | 0-9 Yrs | 1414 (10%) | 5409 (9%) | 11330 (9%) |
10-19 Yrs | 1404 (10%) | 5575 (9%) | 12142 (10%) | |
20-29 Yrs | 1891 (14%) | 9161 (15%) | 17172 (15%) | |
30-39 Yrs | 1838 (13%) | 7014 (12%) | 13262 (11%) | |
40-49 Yrs | 1436 (10%) | 6430 (11%) | 13578 (11%) | |
50-59 Yrs | 1917 (14%) | 9015 (15%) | 17008 (14%) | |
60-69 Yrs | 1603 (12%) | 7551 (12%) | 14698 (12%) | |
70+ Yrs | 1667 (12%) | 8290 (14%) | 15094 (13%) | |
Median HH Income | $56,322 | $58,475 | $53,629 | |
Total Household Income | < 24K | 1130 (19%) | 4779 (17%) | 10895 (20%) |
25-49K | 1465 (25%) | 6876 (25%) | 13912 (26%) | |
50-74K | 1522 (26%) | 5976 (21%) | 10602 (20%) | |
75-99K | 906 (15%) | 4306 (15%) | 7128 (13%) | |
100-199K | 713 (12%) | 4700 (17%) | 8862 (16%) | |
200K+ | 94 (1%) | 611 (2%) | 1447 (2%) | |
Highest Education Level | No Diploma | 764 | 2854 | 6330 |
Diploma or GED | 3473 | 14703 | 26488 | |
Some College | 2606 | 11113 | 20995 | |
Assoc. Degree | 1032 | 3870 | 7868 | |
Bachelors Degree | 1088 | 7363 | 14400 | |
Higher Degree | 584 | 3591 | 6936 | |
Total Housing Units | 6,092 | 29,698 | 57,675 | |
--Owner-Occupied | 4,118 | 18,291 | 31,938 | |
--Renter-Occupied | 1,712 | 8,956 | 20,908 | |
Owner-Occupied Values | < 100K | 1167 | 4685 | 8913 |
100-199K | 2718 | 10893 | 16353 | |
200-299K | 112 | 1734 | 3796 | |
300-399K | 21 | 447 | 1541 | |
400-499K | 58 | 188 | 605 | |
500K+ | 41 | 345 | 729 | |
Total Working Age Population | 10,910 | 49,792 | 96,128 | |
In Work Force | 7,401 | 33,529 | 63,633 | |
Not In Work Force | 3,509 | 16,264 | 32,495 | |
Workforce Employed | 6,811 | 31,761 | 60,182 | |
Workforce Unemployed | 590 | 1,758 | 3,415 | |
Civlian Workforce | 7,401 | 33,519 | 63,597 | |
Military Workforce | 0 | 10 | 36 | |
Total Households | 5,830 | 27,247 | 52,845 | |
Family Households | 3,218 | 14,741 | 29,109 | |
Non-Family Households | 2,612 | 12,506 | 23,737 | |
Married Couple | 2,188 | 10,376 | 19,332 | |
Other Family | 1,030 | 4,364 | 9,777 | |
Married w/Child | 798 | 3,205 | 6,224 | |
Single Male w/Child | 175 | 691 | 1,082 | |
Single Female w/Child | 342 | 1,460 | 3,748 |
Population Change Last Two Decades - Plus Projection
2000 | % | 2010 | % | 2020 | % | 2030 | |
---|---|---|---|---|---|---|---|
Ohio | 11,353,140 | +2 | 11,536,504 | 0 | 11,574,870 | 0 | 11,615,100 |
Lake County | 227,511 | +1 | 230,041 | -1 | 228,600 | 0 | 228,380 |
Cuyahoga County | 1,393,978 | -8 | 1,280,122 | -6 | 1,209,550 | -5 | 1,154,210 |
Total Working Age Population:
Total Households:
Total Working Age Population:
Total Households:
Total Working Age Population:
Total Households: