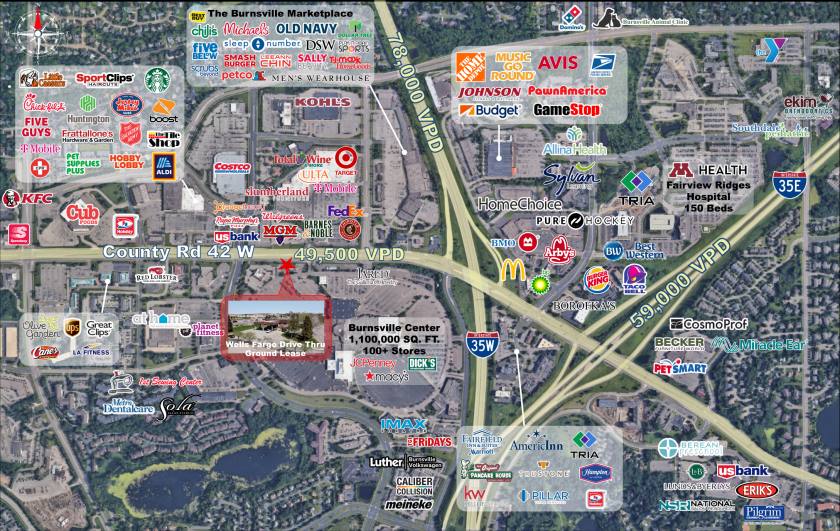
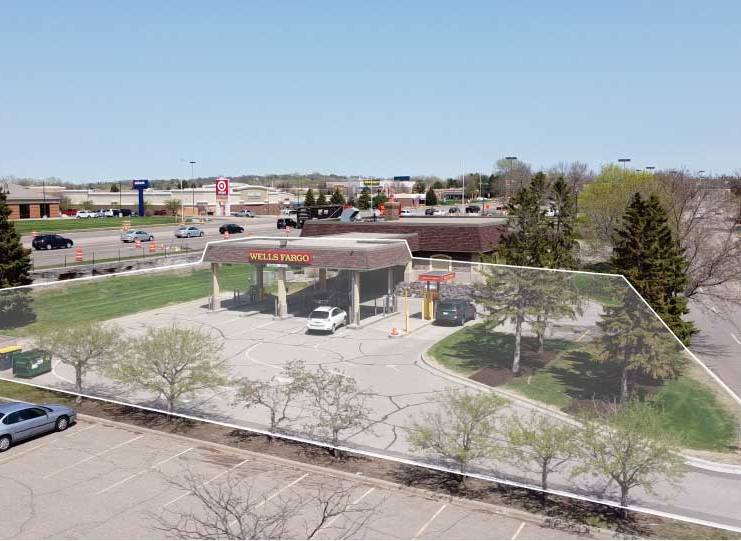
1-Mile | 3-Miles | 5-Miles | ||
---|---|---|---|---|
Total Population | 8,667 | 72,189 | 173,042 | |
Population Median Age | 38 | 39 | 38 | |
Population by Age | 0-9 Yrs | 1300 (14%) | 9894 (13%) | 22541 (13%) |
10-19 Yrs | 1079 (12%) | 8704 (12%) | 23100 (13%) | |
20-29 Yrs | 1197 (13%) | 9744 (13%) | 21140 (12%) | |
30-39 Yrs | 1235 (14%) | 10091 (13%) | 24184 (13%) | |
40-49 Yrs | 796 (9%) | 7582 (10%) | 20961 (12%) | |
50-59 Yrs | 969 (11%) | 10544 (14%) | 25946 (14%) | |
60-69 Yrs | 947 (10%) | 7996 (11%) | 18367 (10%) | |
70+ Yrs | 1143 (13%) | 7634 (10%) | 16803 (9%) | |
Median HH Income | $68,357 | $83,466 | $91,461 | |
Total Household Income | < 24K | 691 (20%) | 2911 (10%) | 5884 (9%) |
25-49K | 698 (20%) | 4994 (18%) | 10372 (16%) | |
50-74K | 426 (12%) | 4243 (15%) | 10300 (15%) | |
75-99K | 478 (14%) | 3896 (14%) | 8886 (13%) | |
100-199K | 943 (28%) | 8824 (32%) | 22489 (34%) | |
200K+ | 114 (3%) | 2067 (7%) | 6884 (10%) | |
Highest Education Level | No Diploma | 437 | 3461 | 6436 |
Diploma or GED | 1302 | 10150 | 22383 | |
Some College | 1262 | 9998 | 23238 | |
Assoc. Degree | 539 | 5635 | 13644 | |
Bachelors Degree | 1444 | 13811 | 36220 | |
Higher Degree | 618 | 5700 | 15203 | |
Total Housing Units | 3,566 | 27,850 | 66,606 | |
--Owner-Occupied | 1,766 | 19,469 | 49,043 | |
--Renter-Occupied | 1,583 | 7,466 | 15,772 | |
Owner-Occupied Values | < 100K | 16 | 1409 | 2304 |
100-199K | 412 | 2958 | 6796 | |
200-299K | 727 | 7924 | 18705 | |
300-399K | 526 | 5086 | 12873 | |
400-499K | 78 | 1205 | 5238 | |
500K+ | 6 | 886 | 3126 | |
Total Working Age Population | 6,691 | 57,210 | 136,370 | |
In Work Force | 4,400 | 41,198 | 100,349 | |
Not In Work Force | 2,291 | 16,012 | 36,021 | |
Workforce Employed | 4,252 | 39,394 | 96,170 | |
Workforce Unemployed | 142 | 1,775 | 3,920 | |
Civlian Workforce | 4,394 | 41,169 | 100,089 | |
Military Workforce | 6 | 29 | 259 | |
Total Households | 3,349 | 26,935 | 64,815 | |
Family Households | 1,910 | 18,955 | 46,136 | |
Non-Family Households | 1,439 | 7,980 | 18,680 | |
Married Couple | 1,332 | 14,453 | 36,630 | |
Other Family | 578 | 4,502 | 9,505 | |
Married w/Child | 461 | 5,660 | 15,363 | |
Single Male w/Child | 69 | 638 | 1,497 | |
Single Female w/Child | 307 | 1,858 | 4,183 |
Population Change Last Two Decades - Plus Projection
2000 | % | 2010 | % | 2020 | % | 2030 | |
---|---|---|---|---|---|---|---|
Minnesota | 4,919,479 | +8 | 5,303,925 | +7 | 5,687,161 | +5 | 5,974,304 |
Dakota County | 355,904 | +12 | 398,552 | +9 | 434,203 | +7 | 463,564 |
Hennepin County | 1,116,200 | +3 | 1,152,425 | +12 | 1,294,371 | +9 | 1,407,332 |
Scott County | 89,498 | +45 | 129,928 | +18 | 152,927 | +13 | 172,140 |
Total Working Age Population:
Total Households:
Total Working Age Population:
Total Households:
Total Working Age Population:
Total Households: