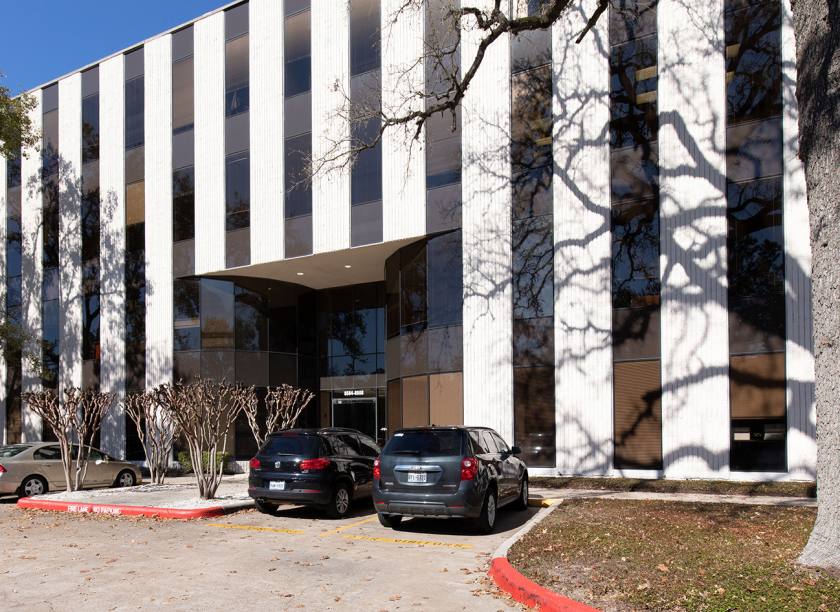
Office Space
8554 Katy Freeway Houston, TX 77024
8554 Katy Freeway Houston, TX 77024
Details & Description
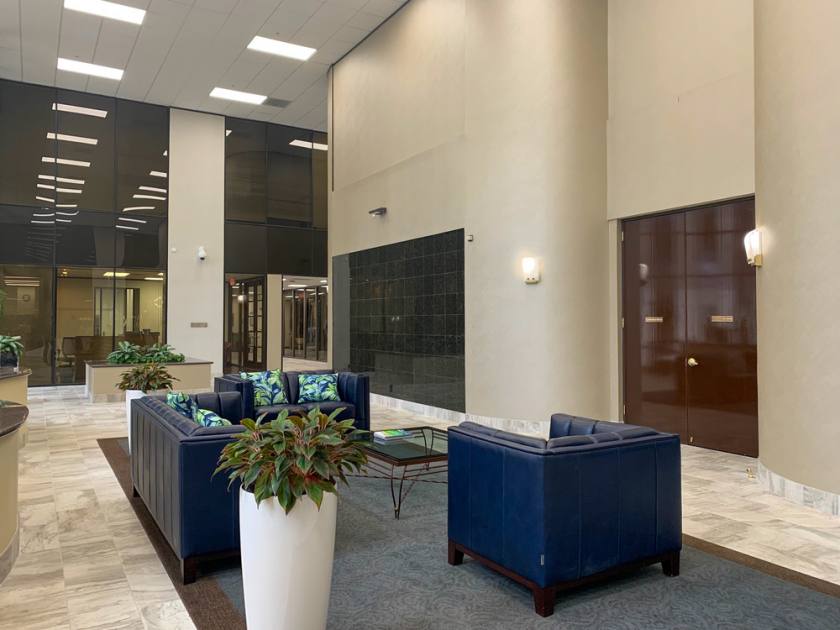
Property Highlights
- • Onsite management and ownership
- • Onsite security
- • Covered and guest parking
- • Updated common areas
- • Large auditorium and conference facility
- • Lush landscape and park-like grounds
Additional Photos


Listing Agents

Douglas Pack
O: 713-835-0041
M: 713-818-5782
doug.pack@colliers.com
O: 713-835-0041
M: 713-818-5782
doug.pack@colliers.com
While we strive to provide the most accurate information, all listing information, and demographic data, is provided by third-parties. As such, MyEListing will not be responsible for the accuracy of the information. It is strongly recommended that you verify all information with the listing agent, and any relevant agencies, prior to making any decisions.


