Commercial Land
14811 Katy Fwy Houston, TX 77094
14811 Katy Fwy Houston, TX 77094
Details & Description
Property Highlights
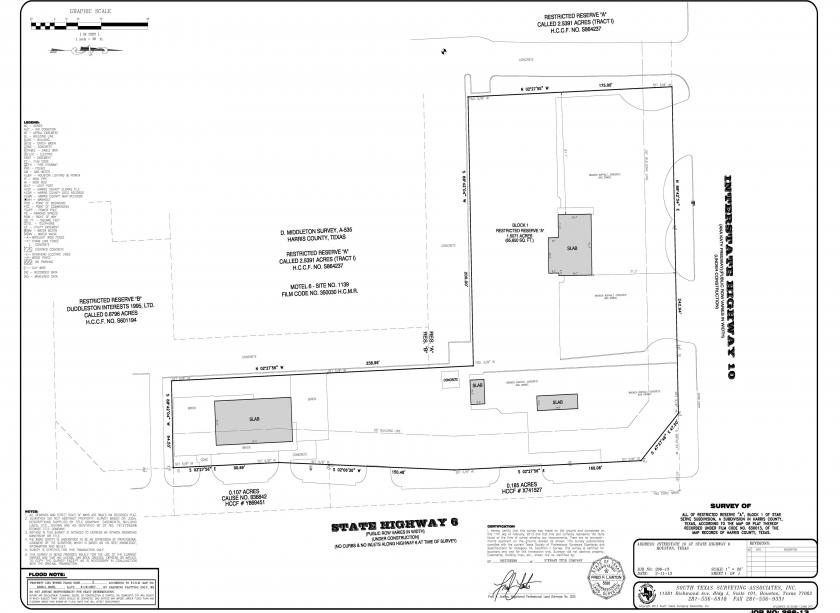
- • Southwest corner of I-10 west and Hwy 6
- • Great location for Bank, or Fast food franchise
- • Very heavy trafic on I-10 west and Hwy 6
- • Prime location
Listing Agents

Arun Parikh
aprop@hotmail.com
aprop@hotmail.com
While we strive to provide the most accurate information, all listing information, and demographic data, is provided by third-parties. As such, MyEListing will not be responsible for the accuracy of the information. It is strongly recommended that you verify all information with the listing agent, and any relevant agencies, prior to making any decisions.

