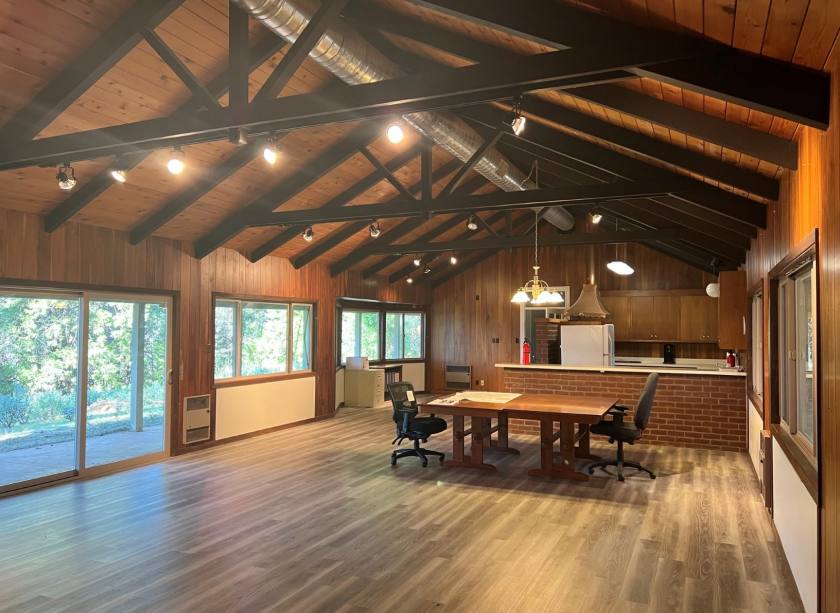
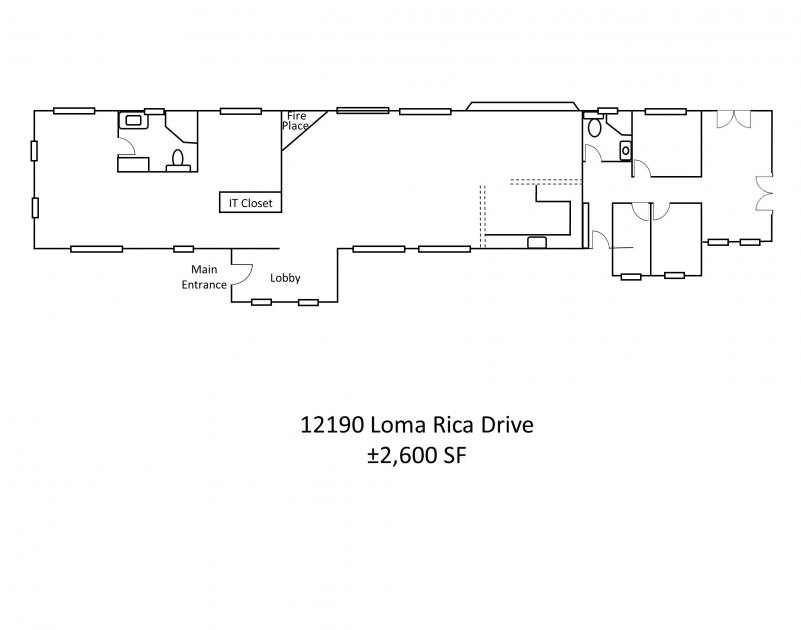
1-Mile | 3-Miles | 5-Miles | ||
---|---|---|---|---|
Total Population | 2,670 | 20,861 | 35,122 | |
Population Median Age | 45 | 48 | 47 | |
Population by Age | 0-9 Yrs | 221 (8%) | 1577 (7%) | 2893 (8%) |
10-19 Yrs | 379 (14%) | 2165 (10%) | 3475 (9%) | |
20-29 Yrs | 230 (8%) | 2086 (9%) | 3422 (9%) | |
30-39 Yrs | 343 (12%) | 2155 (10%) | 3684 (10%) | |
40-49 Yrs | 195 (7%) | 1952 (9%) | 3483 (9%) | |
50-59 Yrs | 350 (13%) | 2597 (12%) | 4556 (12%) | |
60-69 Yrs | 513 (19%) | 3858 (18%) | 6642 (18%) | |
70+ Yrs | 437 (16%) | 4472 (21%) | 6969 (19%) | |
Median HH Income | $38,174 | $50,642 | $54,752 | |
Total Household Income | < 24K | 484 (39%) | 2325 (24%) | 3315 (21%) |
25-49K | 270 (21%) | 2453 (25%) | 3918 (25%) | |
50-74K | 252 (20%) | 1750 (18%) | 2737 (17%) | |
75-99K | 86 (6%) | 1003 (10%) | 1693 (10%) | |
100-199K | 103 (8%) | 1534 (15%) | 2876 (18%) | |
200K+ | 44 (3%) | 591 (6%) | 1057 (6%) | |
Highest Education Level | No Diploma | 213 | 1083 | 1668 |
Diploma or GED | 432 | 3352 | 5376 | |
Some College | 580 | 4656 | 7928 | |
Assoc. Degree | 189 | 1468 | 2713 | |
Bachelors Degree | 412 | 3400 | 5692 | |
Higher Degree | 147 | 2158 | 3713 | |
Total Housing Units | 1,357 | 10,832 | 17,331 | |
--Owner-Occupied | 464 | 5,076 | 9,403 | |
--Renter-Occupied | 774 | 4,581 | 6,194 | |
Owner-Occupied Values | < 100K | 135 | 510 | 1041 |
100-199K | 1 | 81 | 304 | |
200-299K | 28 | 623 | 1091 | |
300-399K | 116 | 1487 | 2617 | |
400-499K | 52 | 814 | 1471 | |
500K+ | 132 | 1561 | 2878 | |
Total Working Age Population | 2,192 | 17,980 | 30,105 | |
In Work Force | 1,030 | 9,203 | 16,013 | |
Not In Work Force | 1,163 | 8,777 | 14,093 | |
Workforce Employed | 1,010 | 8,893 | 15,419 | |
Workforce Unemployed | 20 | 278 | 536 | |
Civlian Workforce | 1,030 | 9,171 | 15,955 | |
Military Workforce | 0 | 32 | 58 | |
Total Households | 1,238 | 9,657 | 15,596 | |
Family Households | 646 | 4,895 | 8,439 | |
Non-Family Households | 593 | 4,763 | 7,157 | |
Married Couple | 289 | 3,324 | 6,006 | |
Other Family | 357 | 1,571 | 2,433 | |
Married w/Child | 74 | 900 | 1,557 | |
Single Male w/Child | 12 | 103 | 275 | |
Single Female w/Child | 216 | 778 | 988 |
Population Change Last Two Decades - Plus Projection
2000 | % | 2010 | % | 2020 | % | 2030 | |
---|---|---|---|---|---|---|---|
California | 33,871,648 | +10 | 37,253,956 | +9 | 40,467,295 | +8 | 43,631,295 |
Nevada County | 92,033 | +7 | 98,764 | +1 | 99,578 | +6 | 105,214 |
Total Working Age Population:
Total Households:
Total Working Age Population:
Total Households:
Total Working Age Population:
Total Households: