Industrial Properties
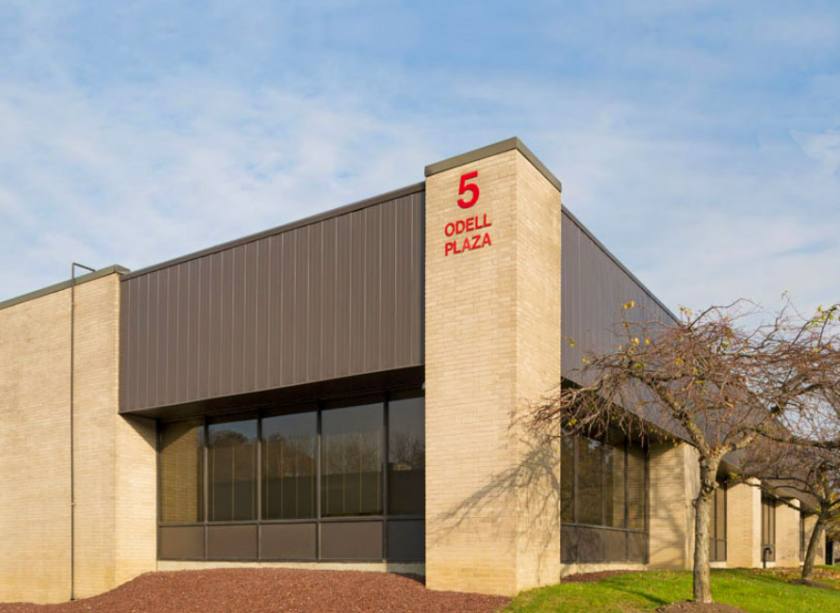
5 Odell Plaza Yonkers, NY 10701
5 Odell Plaza Yonkers, NY 10701
Details & Description
Property Highlights
• TRANSPORTATION: Easy access to NYST—I-87, Saw Mill River, Sprain & Cross County Parkways, Bus, Rte. 9, and Me
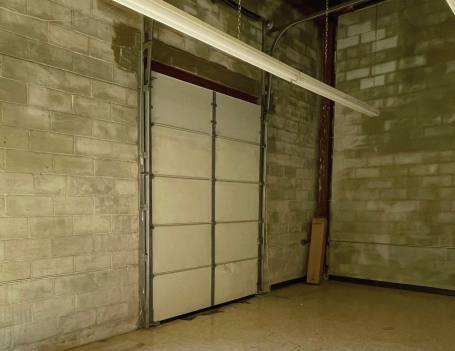
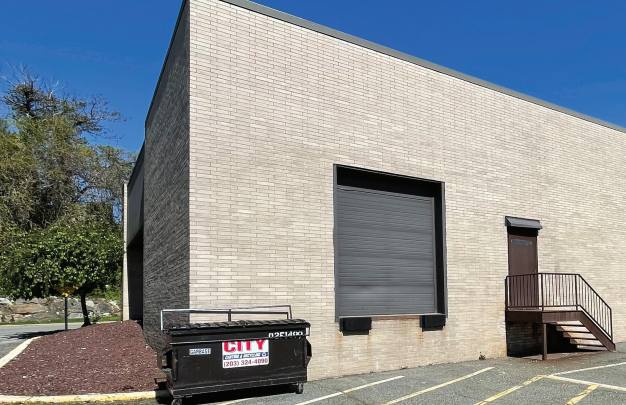
• WAREHOUSE: 500 RSF OFFICE: 1,250 RSF - All spaces can be reconfigured to meet tenant’s requirement
Listing Agents

William Anson
O: 914-363-7906
M: 203-984-0046
wanson@rmfriedland.com
O: 914-363-7906
M: 203-984-0046
wanson@rmfriedland.com
While we strive to provide the most accurate information, all listing information, and demographic data, is provided by third-parties. As such, MyEListing will not be responsible for the accuracy of the information. It is strongly recommended that you verify all information with the listing agent, and any relevant agencies, prior to making any decisions.