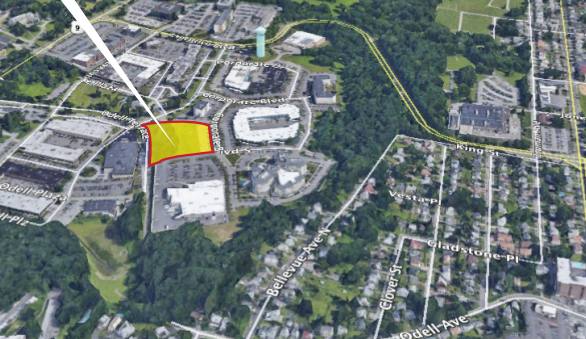
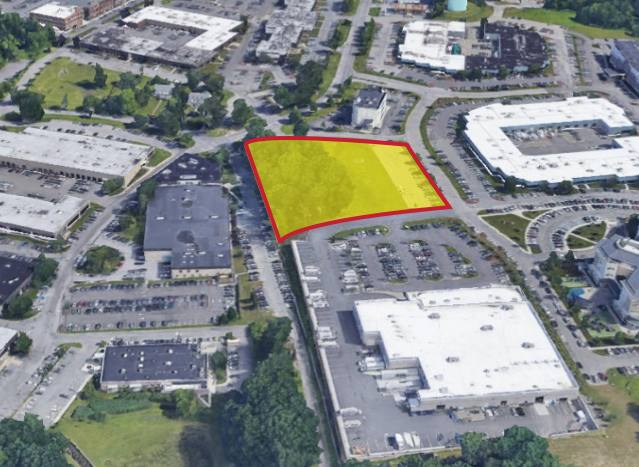
1-Mile | 3-Miles | 5-Miles | ||
---|---|---|---|---|
Total Population | 17,665 | 138,827 | 394,514 | |
Population Median Age | 44 | 40 | 40 | |
Population by Age | 0-9 Yrs | 1576 (8%) | 15962 (11%) | 46381 (11%) |
10-19 Yrs | 1694 (9%) | 17510 (12%) | 50678 (12%) | |
20-29 Yrs | 2259 (12%) | 18199 (13%) | 46188 (11%) | |
30-39 Yrs | 2452 (13%) | 18959 (13%) | 48865 (12%) | |
40-49 Yrs | 2123 (12%) | 16190 (11%) | 53276 (13%) | |
50-59 Yrs | 2479 (14%) | 18030 (12%) | 54095 (13%) | |
60-69 Yrs | 2246 (12%) | 15752 (11%) | 44560 (11%) | |
70+ Yrs | 2836 (16%) | 18224 (13%) | 50472 (12%) | |
Median HH Income | $100,373 | $75,111 | $84,577 | |
Total Household Income | < 24K | 716 (10%) | 9998 (19%) | 24667 (16%) |
25-49K | 1074 (15%) | 8711 (16%) | 24005 (16%) | |
50-74K | 923 (13%) | 7384 (14%) | 19164 (12%) | |
75-99K | 759 (10%) | 5880 (11%) | 16961 (11%) | |
100-199K | 2481 (35%) | 12754 (24%) | 37445 (25%) | |
200K+ | 1013 (14%) | 7511 (14%) | 26426 (17%) | |
Highest Education Level | No Diploma | 1327 | 14699 | 34964 |
Diploma or GED | 2689 | 22455 | 58488 | |
Some College | 2213 | 14175 | 39581 | |
Assoc. Degree | 986 | 7277 | 18437 | |
Bachelors Degree | 3089 | 20060 | 63530 | |
Higher Degree | 3124 | 17503 | 59379 | |
Total Housing Units | 7,304 | 55,842 | 157,726 | |
--Owner-Occupied | 5,182 | 26,482 | 81,455 | |
--Renter-Occupied | 1,784 | 25,755 | 67,213 | |
Owner-Occupied Values | < 100K | 116 | 1095 | 3970 |
100-199K | 805 | 3378 | 9206 | |
200-299K | 629 | 2977 | 7486 | |
300-399K | 1043 | 3642 | 8722 | |
400-499K | 1012 | 4098 | 10401 | |
500K+ | 1577 | 11292 | 41671 | |
Total Working Age Population | 14,995 | 112,541 | 318,018 | |
In Work Force | 9,792 | 71,308 | 203,377 | |
Not In Work Force | 5,203 | 41,233 | 114,641 | |
Workforce Employed | 9,105 | 66,830 | 191,187 | |
Workforce Unemployed | 687 | 4,466 | 12,172 | |
Civlian Workforce | 9,792 | 71,296 | 203,359 | |
Military Workforce | 0 | 12 | 18 | |
Total Households | 6,966 | 52,238 | 148,668 | |
Family Households | 4,375 | 33,852 | 97,698 | |
Non-Family Households | 2,591 | 18,386 | 50,970 | |
Married Couple | 3,420 | 23,079 | 68,992 | |
Other Family | 955 | 10,772 | 28,706 | |
Married w/Child | 1,177 | 9,328 | 30,789 | |
Single Male w/Child | 50 | 1,360 | 3,229 | |
Single Female w/Child | 290 | 3,944 | 9,633 |
Population Change Last Two Decades - Plus Projection
2000 | % | 2010 | % | 2020 | % | 2030 | |
---|---|---|---|---|---|---|---|
New Jersey | 8,414,350 | +4 | 8,791,894 | +4 | 9,132,700 | +4 | 9,530,900 |
Bergen County | 884,118 | +2 | 905,116 | +7 | 967,500 | +7 | 1,031,500 |
New York | 18,976,457 | +2 | 19,378,102 | +4 | 20,146,131 | +2 | 20,604,030 |
Bronx County | 1,332,650 | +4 | 1,385,108 | +10 | 1,519,809 | +6 | 1,604,168 |
Westchester County | 923,459 | +3 | 949,113 | +5 | 996,039 | +4 | 1,037,234 |
Rockland County | 286,753 | +9 | 311,687 | +8 | 336,544 | +6 | 356,758 |
Total Working Age Population:
Total Households:
Total Working Age Population:
Total Households:
Total Working Age Population:
Total Households: