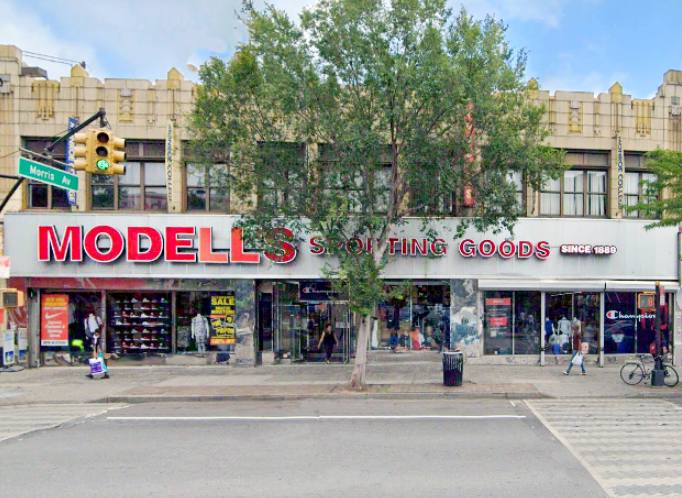
1-Mile | 3-Miles | 5-Miles | ||
---|---|---|---|---|
Total Population | 219,166 | 1,209,192 | 2,083,001 | |
Population Median Age | 34 | 36 | 37 | |
Population by Age | 0-9 Yrs | 34551 (15%) | 165569 (13%) | 269266 (12%) |
10-19 Yrs | 31258 (14%) | 159533 (13%) | 261416 (12%) | |
20-29 Yrs | 38602 (17%) | 199588 (16%) | 336505 (16%) | |
30-39 Yrs | 31085 (14%) | 179083 (14%) | 309089 (14%) | |
40-49 Yrs | 25995 (11%) | 145984 (12%) | 258887 (12%) | |
50-59 Yrs | 25319 (11%) | 149135 (12%) | 258139 (12%) | |
60-69 Yrs | 17319 (7%) | 111149 (9%) | 198436 (9%) | |
70+ Yrs | 15036 (6%) | 99150 (8%) | 191263 (9%) | |
Median HH Income | $35,818 | $42,163 | $46,361 | |
Total Household Income | < 24K | 29444 (39%) | 147356 (34%) | 240951 (31%) |
25-49K | 18161 (24%) | 96791 (22%) | 162175 (21%) | |
50-74K | 12470 (16%) | 69780 (16%) | 117524 (15%) | |
75-99K | 6511 (8%) | 43466 (10%) | 80278 (10%) | |
100-199K | 7096 (9%) | 61004 (14%) | 126668 (16%) | |
200K+ | 924 (1%) | 13878 (3%) | 38292 (4%) | |
Highest Education Level | No Diploma | 44175 | 219343 | 338604 |
Diploma or GED | 38305 | 205744 | 356820 | |
Some College | 24400 | 134454 | 230694 | |
Assoc. Degree | 10310 | 57459 | 100010 | |
Bachelors Degree | 12698 | 111201 | 226236 | |
Higher Degree | 5481 | 66973 | 150040 | |
Total Housing Units | 77,956 | 453,577 | 809,377 | |
--Owner-Occupied | 4,740 | 60,095 | 155,560 | |
--Renter-Occupied | 69,867 | 372,181 | 610,327 | |
Owner-Occupied Values | < 100K | 681 | 6640 | 18631 |
100-199K | 720 | 6665 | 13795 | |
200-299K | 728 | 6755 | 15302 | |
300-399K | 356 | 7815 | 19976 | |
400-499K | 573 | 9776 | 26098 | |
500K+ | 1681 | 22443 | 61758 | |
Total Working Age Population | 166,494 | 946,854 | 1,656,409 | |
In Work Force | 102,531 | 581,980 | 1,011,463 | |
Not In Work Force | 63,963 | 364,875 | 644,946 | |
Workforce Employed | 90,298 | 520,462 | 915,945 | |
Workforce Unemployed | 12,023 | 61,085 | 94,852 | |
Civlian Workforce | 102,321 | 581,547 | 1,010,797 | |
Military Workforce | 210 | 433 | 666 | |
Total Households | 74,608 | 432,275 | 765,887 | |
Family Households | 49,206 | 271,690 | 468,860 | |
Non-Family Households | 25,402 | 160,586 | 297,027 | |
Married Couple | 17,714 | 115,932 | 214,981 | |
Other Family | 31,493 | 155,758 | 253,879 | |
Married w/Child | 9,268 | 54,589 | 96,391 | |
Single Male w/Child | 2,669 | 11,984 | 19,150 | |
Single Female w/Child | 13,074 | 62,266 | 97,842 |
Population Change Last Two Decades - Plus Projection
2000 | % | 2010 | % | 2020 | % | 2030 | |
---|---|---|---|---|---|---|---|
New Jersey | 8,414,350 | +4 | 8,791,894 | +4 | 9,132,700 | +4 | 9,530,900 |
Bergen County | 884,118 | +2 | 905,116 | +7 | 967,500 | +7 | 1,031,500 |
New York | 18,976,457 | +2 | 19,378,102 | +4 | 20,146,131 | +2 | 20,604,030 |
Queens County | 2,229,379 | 0 | 2,230,722 | +9 | 2,436,549 | +5 | 2,565,268 |
Bronx County | 1,332,650 | +4 | 1,385,108 | +10 | 1,519,809 | +6 | 1,604,168 |
Westchester County | 923,459 | +3 | 949,113 | +5 | 996,039 | +4 | 1,037,234 |
New York County | 1,537,195 | +3 | 1,585,873 | +6 | 1,688,894 | +2 | 1,727,631 |
Total Working Age Population:
Total Households:
Total Working Age Population:
Total Households:
Total Working Age Population:
Total Households: