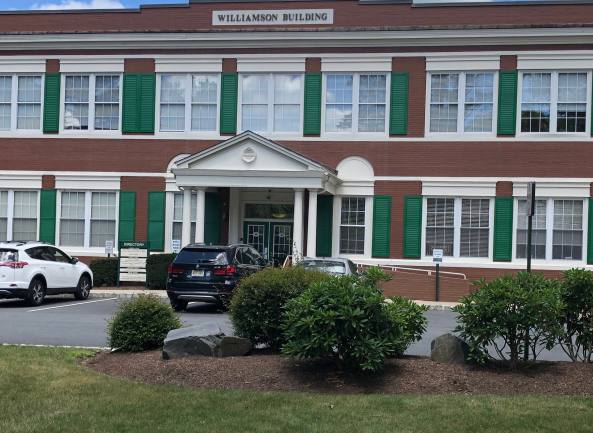
Office Space
245 Main Street Chester, NJ 07930
245 Main Street Chester, NJ 07930
Details & Description
Property Highlights
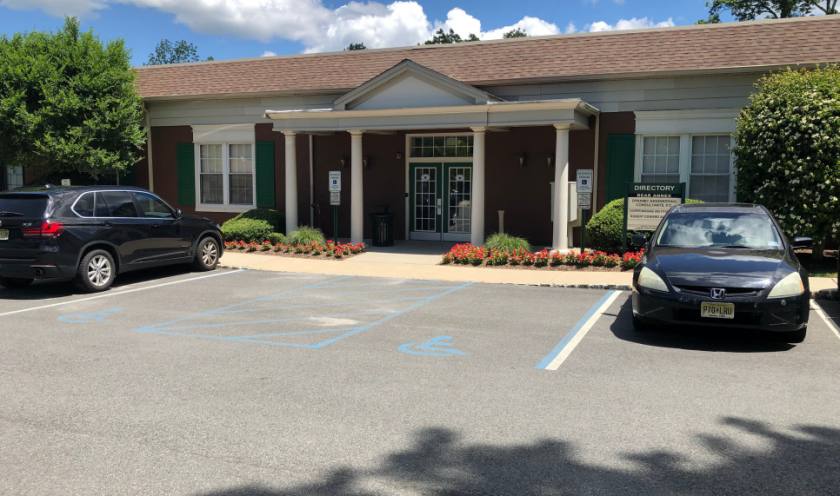
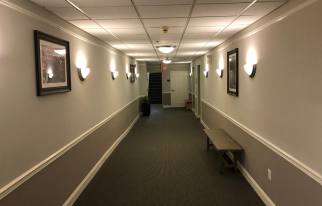
- • Recently renovated interior and exterior
- • ADA compliant
- • High speed internet
- • Walking distance to local shops and eateries
- • Easy access to Routes 80, 206 and 287
Additional Photos


Listing Agents

Bob Bartnett
O: 908-751-7750
M: 908-528-0577
bobbartnett@kwcommercial.com
O: 908-751-7750
M: 908-528-0577
bobbartnett@kwcommercial.com
While we strive to provide the most accurate information, all listing information, and demographic data, is provided by third-parties. As such, MyEListing will not be responsible for the accuracy of the information. It is strongly recommended that you verify all information with the listing agent, and any relevant agencies, prior to making any decisions.


