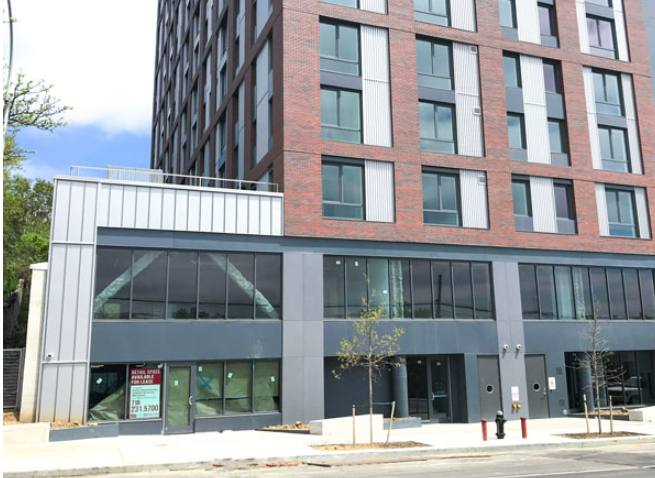
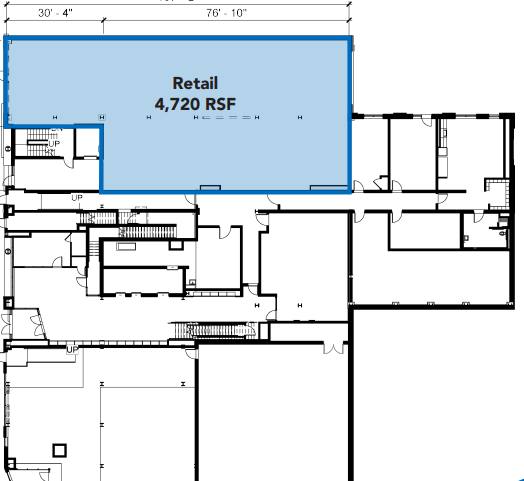
Retail Space
720 Tiffany Street The Bronx, NY 10474
720 Tiffany Street The Bronx, NY 10474
Details & Description
Property Highlights
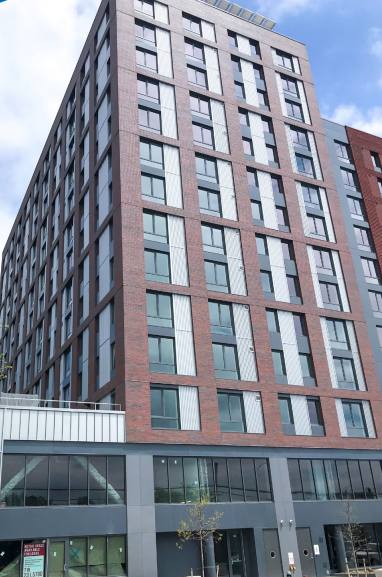
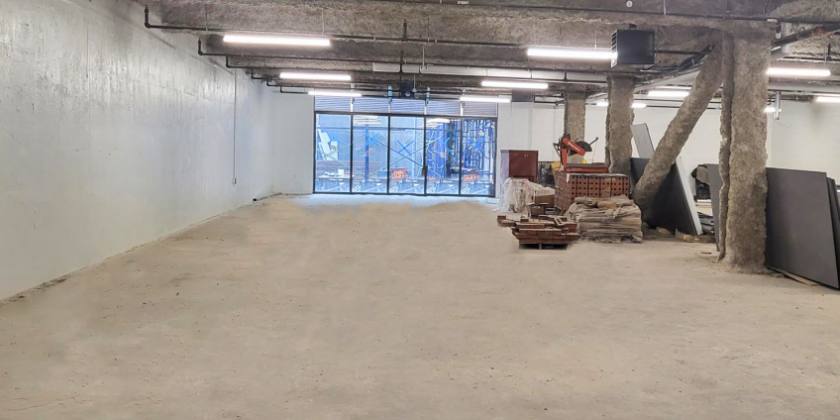
- • Ground floor in brand new development
- • 183 residential units above
- • TCO Q2 of 2022
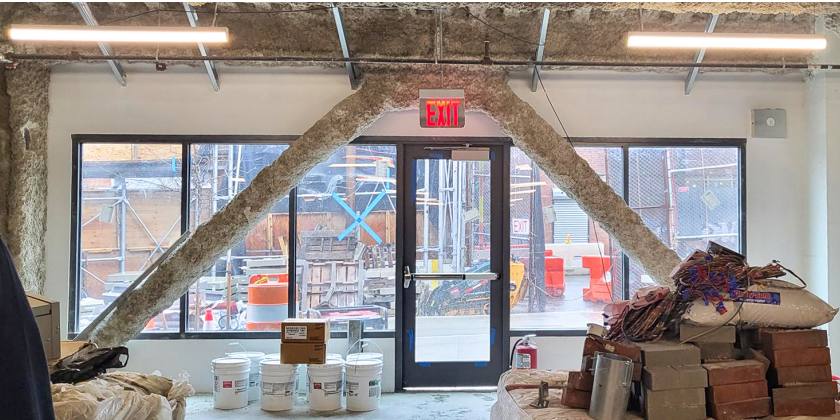
- • Great natural light
- • Over 700 units once the complex is complete
- • Tenant controlled HVAC, sprinkler system
Additional Photos
Listing Agents

Stephen Kaufman
O: 914-361-4675
M: 917-750-7491
skaufman@rmfriedland.com
O: 914-361-4675
M: 917-750-7491
skaufman@rmfriedland.com
While we strive to provide the most accurate information, all listing information, and demographic data, is provided by third-parties. As such, MyEListing will not be responsible for the accuracy of the information. It is strongly recommended that you verify all information with the listing agent, and any relevant agencies, prior to making any decisions.


