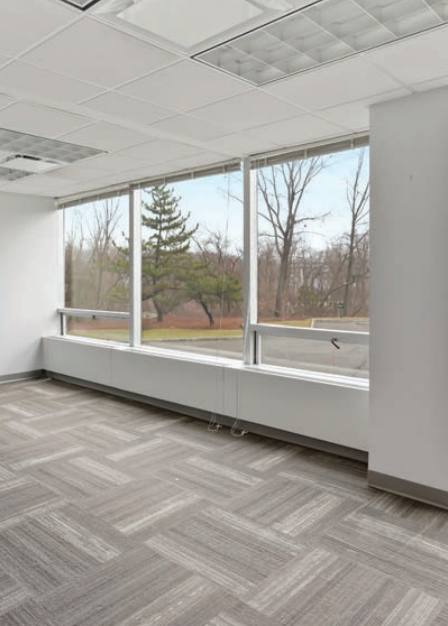
Office Space
2975 Westchester Avenue Harrison, NY 10577
2975 Westchester Avenue Harrison, NY 10577

Details & Description
Property Highlights
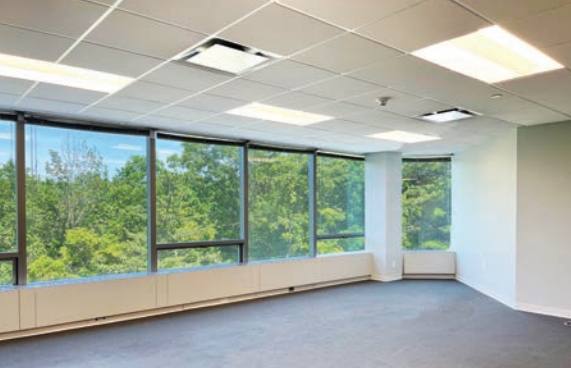
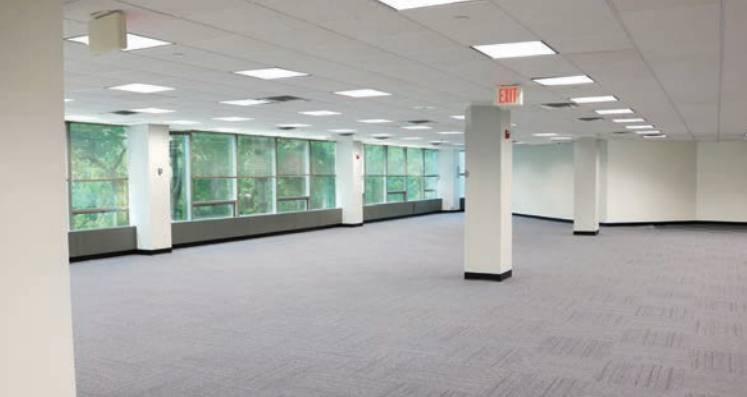
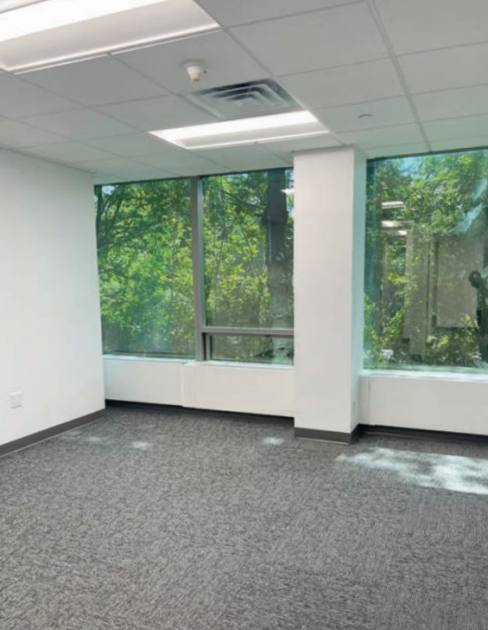
- • Move-in units
- • Flexible terms
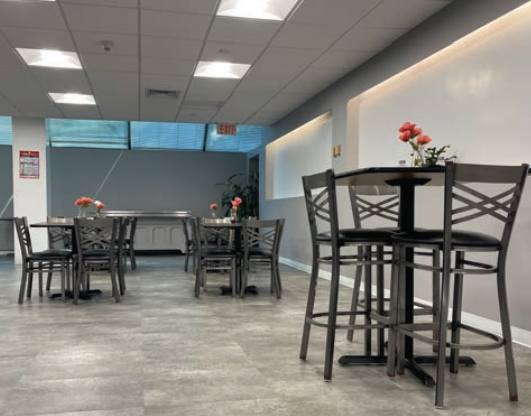
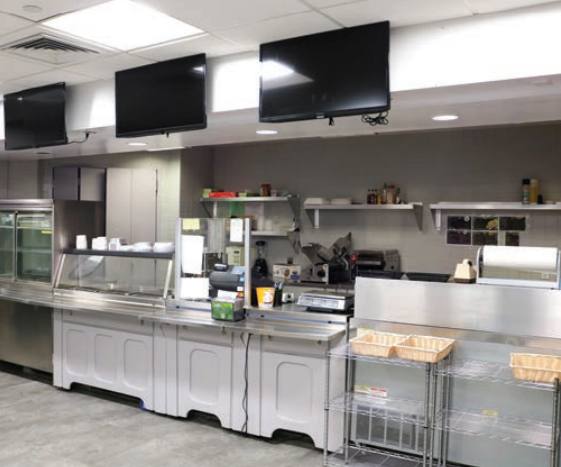
- • Renovated public areas
- • Responsive, on-site property management
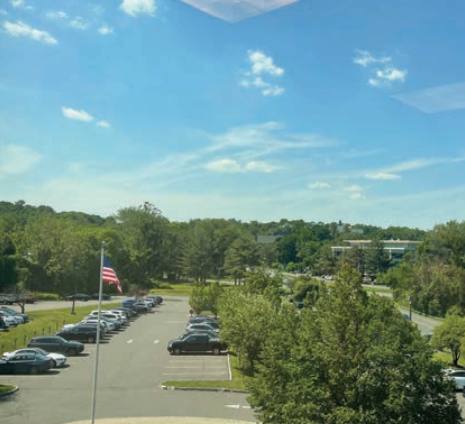
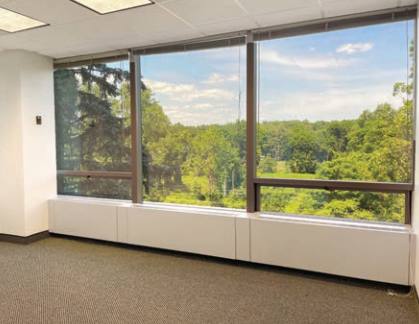
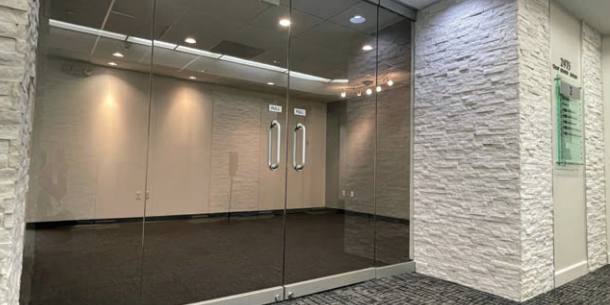
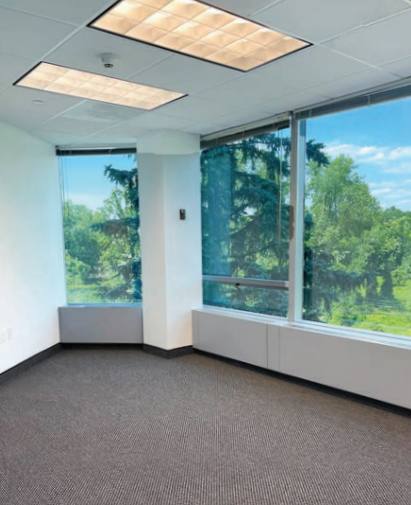
Additional Photos


Listing Agents

Robert Taylor
O: 914-292-1210
rtaylor@rmfriedland.com
O: 914-292-1210
rtaylor@rmfriedland.com

Chris O'Callaghan
O: 914-278-6466
M: 914-325-1597
cocallaghan@rmfriedland.com
O: 914-278-6466
M: 914-325-1597
cocallaghan@rmfriedland.com

Reed Waggoner
RM Friedland
O: 914-292-1211
rwaggoner@rmfriedland.com
RM Friedland
O: 914-292-1211
rwaggoner@rmfriedland.com
While we strive to provide the most accurate information, all listing information, and demographic data, is provided by third-parties. As such, MyEListing will not be responsible for the accuracy of the information. It is strongly recommended that you verify all information with the listing agent, and any relevant agencies, prior to making any decisions.