Retail Space
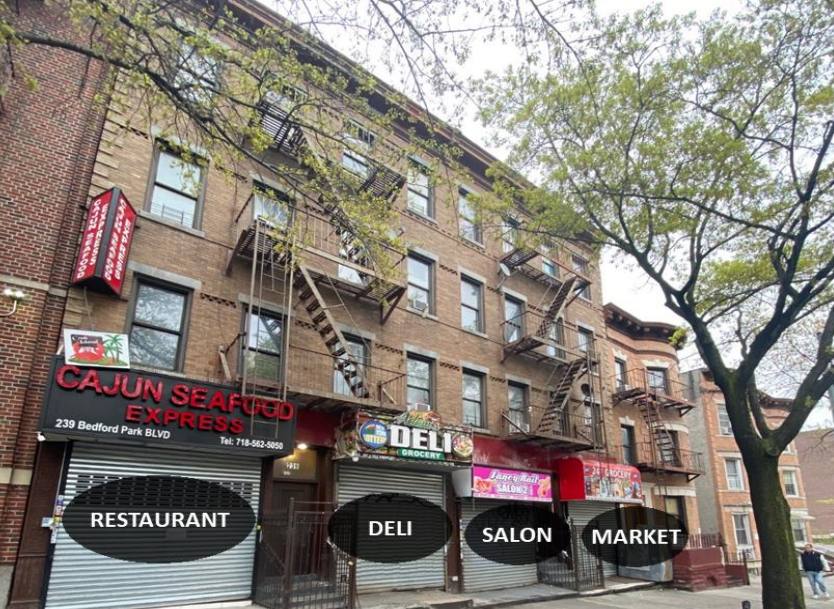
239-241 Bedford Park Blvd The Bronx, NY 10458
239-241 Bedford Park Blvd The Bronx, NY 10458
Details & Description
Property Highlights
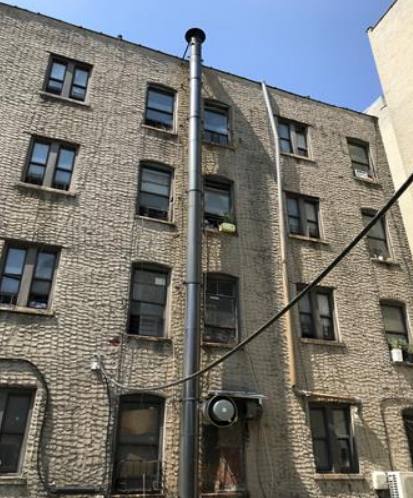
- • 2 mixed use buildings
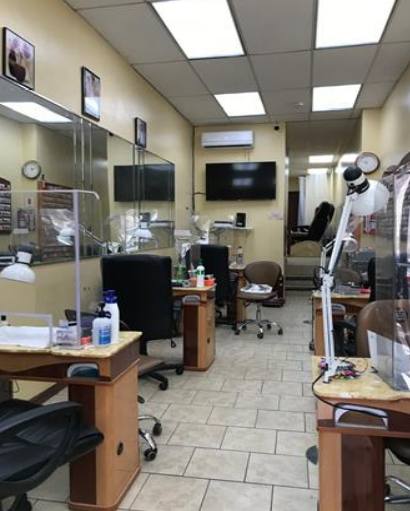
- • 16 Total Units - 12 apartments and 4 stores
- • Zoning District - R7A
- • Intersecting Map Layers - Transit zone, FRESH
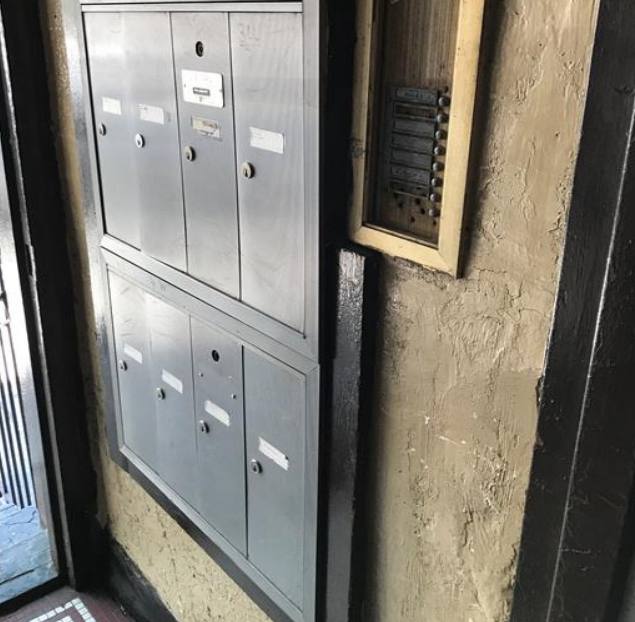
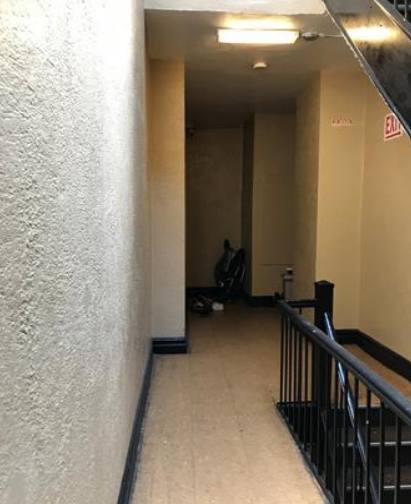
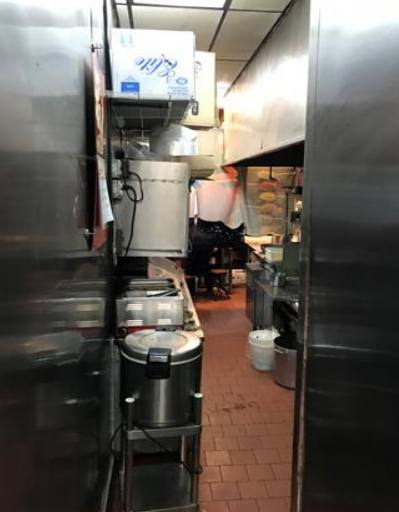
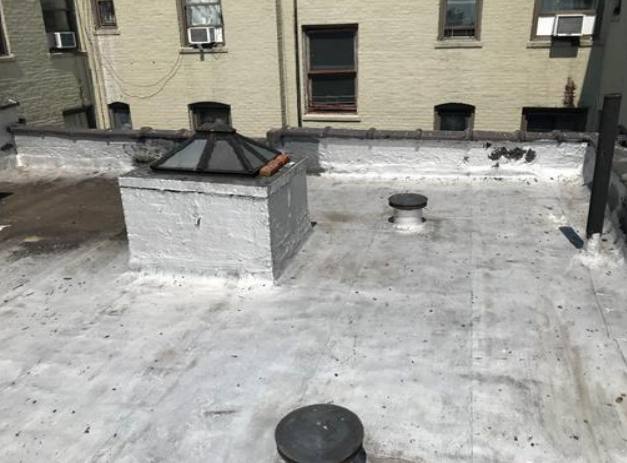
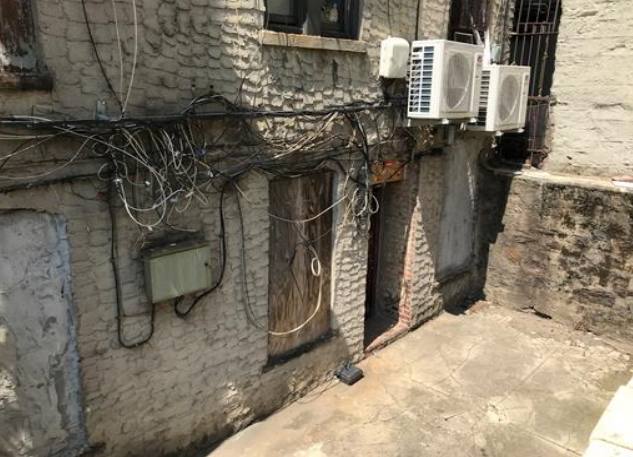
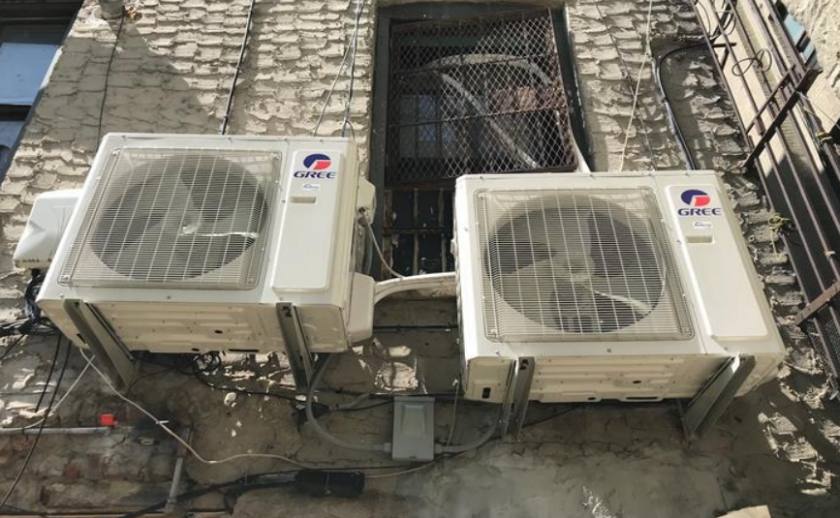
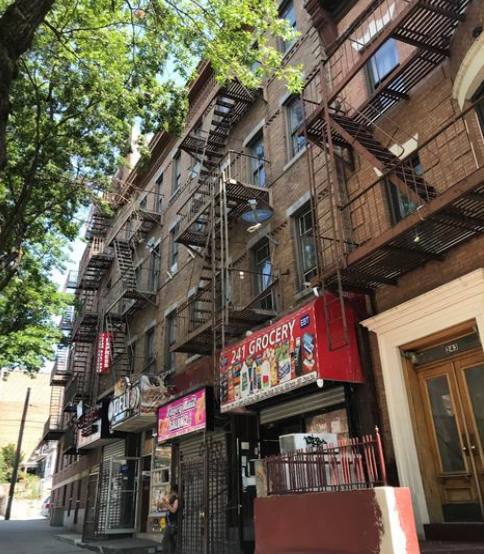
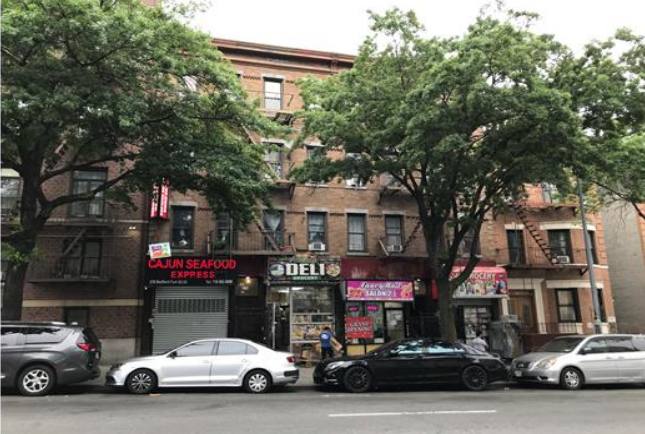
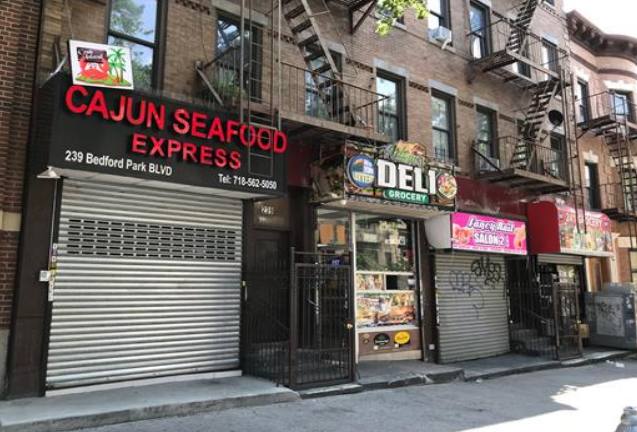
Additional Photos

Listing Agents

Marco Lala
O: 914-380-3806
M: 914-843-3535
mlala@rmfriedland.com
O: 914-380-3806
M: 914-843-3535
mlala@rmfriedland.com
While we strive to provide the most accurate information, all listing information, and demographic data, is provided by third-parties. As such, MyEListing will not be responsible for the accuracy of the information. It is strongly recommended that you verify all information with the listing agent, and any relevant agencies, prior to making any decisions.