Specialty Real Estate
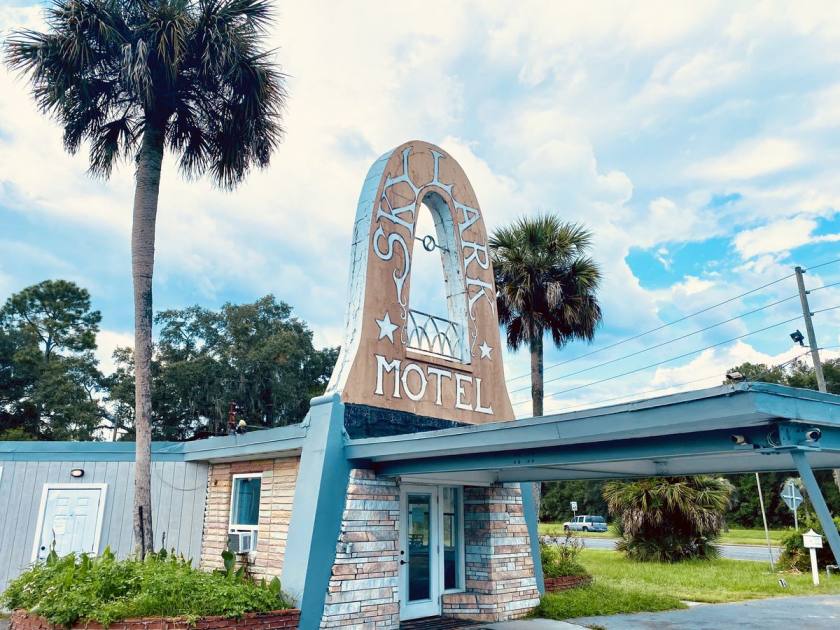
317 North Byron Butler Parkway Perry, FL 32347
317 North Byron Butler Parkway Perry, FL 32347

Details & Description
Property Highlights
- • Number of Units: 33 Units
- • Property Use Type: Investment
- • Sale Terms: Cash to Seller
Additional Photos


Listing Agents

Chip Hartung
O: 850-980-4007
chip@cbhartung.com
O: 850-980-4007
chip@cbhartung.com
While we strive to provide the most accurate information, all listing information, and demographic data, is provided by third-parties. As such, MyEListing will not be responsible for the accuracy of the information. It is strongly recommended that you verify all information with the listing agent, and any relevant agencies, prior to making any decisions.


